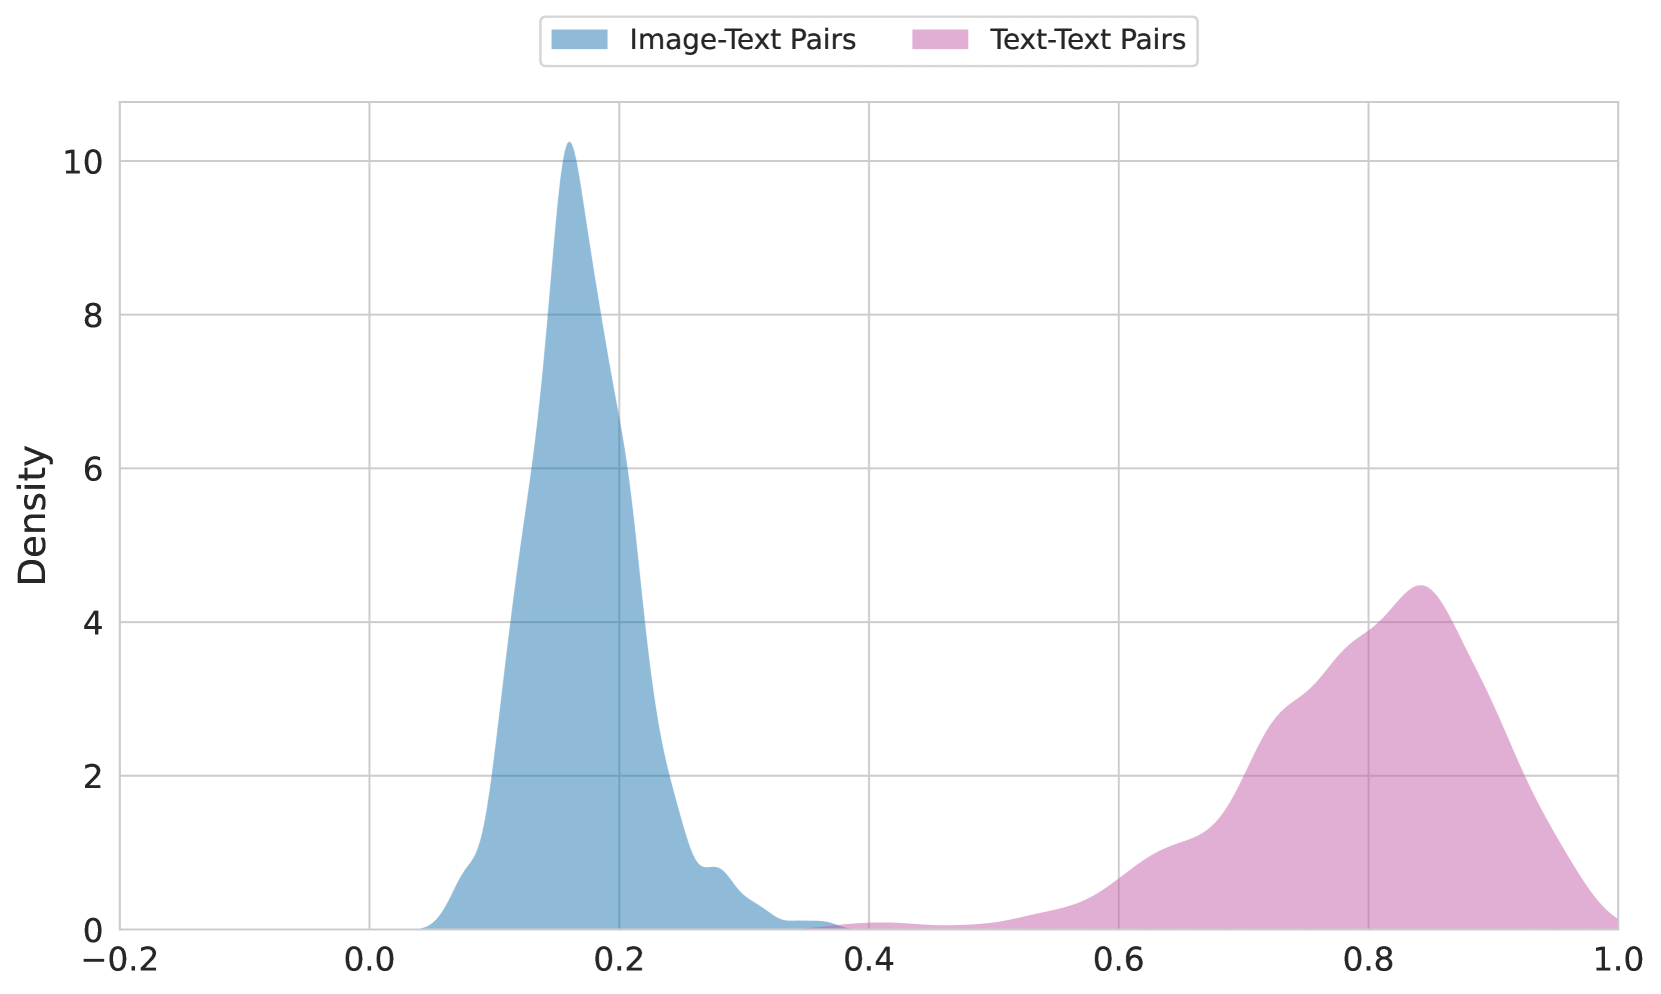
## Density Plot: Image-Text vs. Text-Text Pair Distributions
### Overview
The image displays a density plot comparing two distributions: **Image-Text Pairs** (blue) and **Text-Text Pairs** (pink). The x-axis represents a normalized value (likely a similarity or correlation score), while the y-axis shows density. The blue distribution is sharply peaked, whereas the pink distribution is broader and flatter.
---
### Components/Axes
- **X-Axis**: Labeled as a normalized value (range: **-0.2 to 1.0**), likely representing a similarity or correlation metric.
- **Y-Axis**: Labeled **"Density"** (range: **0 to 10**), indicating the frequency distribution of values.
- **Legend**: Located at the **top-center**, with:
- **Blue**: "Image-Text Pairs"
- **Pink**: "Text-Text Pairs"
---
### Detailed Analysis
1. **Image-Text Pairs (Blue)**:
- **Peak**: Sharp peak at **x ≈ 0.1** with a density of **~10**.
- **Spread**: Tails extend to **x ≈ 0.3**, with density dropping to near zero.
- **Shape**: Unimodal and highly concentrated, suggesting most pairs cluster tightly around 0.1.
2. **Text-Text Pairs (Pink)**:
- **Peak**: Broader peak centered at **x ≈ 0.8** with a density of **~4.5**.
- **Spread**: Tails extend to **x ≈ 0.9**, with density gradually declining.
- **Shape**: Bimodal-like but smoother, indicating a wider distribution of values.
---
### Key Observations
- The **Image-Text Pairs** distribution is significantly narrower and taller than the **Text-Text Pairs**, implying higher concentration around their respective peaks.
- The **Text-Text Pairs** distribution spans a wider range of values (0.6–0.9), suggesting greater variability in their metric.
- No overlapping regions between the two distributions, indicating distinct value ranges for each pair type.
---
### Interpretation
- **Image-Text Pairs** likely represent a more consistent or constrained relationship (e.g., high similarity scores), while **Text-Text Pairs** exhibit broader variability, possibly due to semantic or contextual differences.
- The absence of overlap suggests the two pair types operate in distinct value spaces, which could inform clustering or classification strategies.
- The sharpness of the Image-Text peak may indicate a specific threshold or benchmark for this pair type, whereas the Text-Text distribution’s breadth might reflect ambiguity or diversity in text-based relationships.
*Note: All values are approximate due to the absence of explicit numerical labels on the axes.*