TECHNICAL ASSET FINGERPRINT
538e49085fb4948f663ad07c
Click to view fullscreen
Press ESC or click to close
FOUND IN PAPERS
EXPERT: gemini-2.0-flash VERSION 1
RUNTIME: nugit/gemini/gemini-2.0-flash
INTEL_VERIFIED
## Histogram Grid: Neuron Activation Distributions for Language Models
### Overview
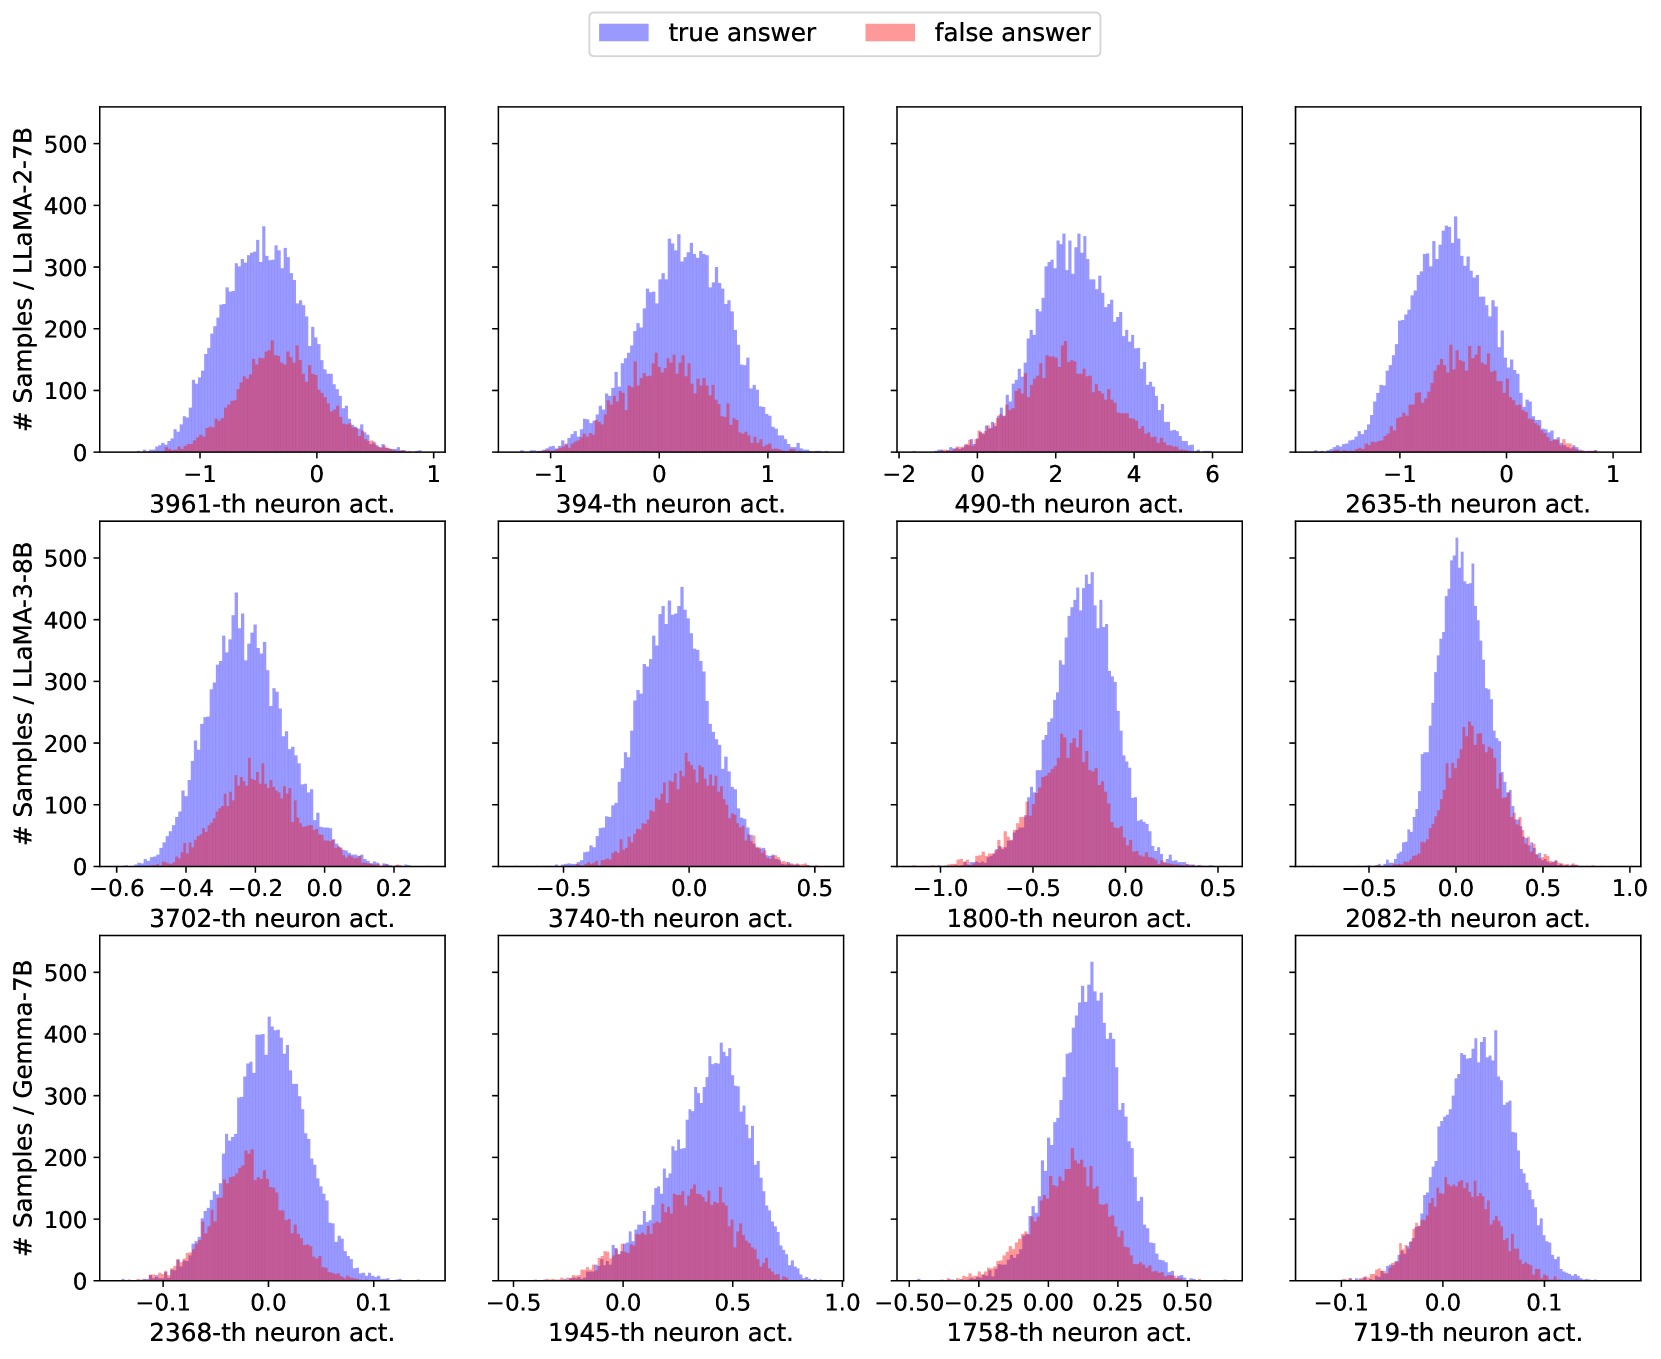
The image presents a grid of 12 histograms, arranged in a 3x4 layout. Each histogram displays the distribution of neuron activations for a specific neuron in different language models (LLaMA-2-7B, LLaMA-3-8B, and Gemma-7B). The distributions are separated into "true answer" and "false answer" categories, represented by blue and red histograms respectively. The x-axis represents the activation value, and the y-axis represents the number of samples.
### Components/Axes
* **Title:** There is no overall title for the figure.
* **Legend:** Located at the top of the image.
* "true answer": Represented by the color blue.
* "false answer": Represented by the color red.
* **Y-Axis:**
* The y-axis label varies depending on the row:
* Top Row: "# Samples / LLaMA-2-7B"
* Middle Row: "# Samples / LLaMA-3-8B"
* Bottom Row: "# Samples / Gemma-7B"
* The y-axis scale ranges from 0 to 500, with tick marks at 0, 100, 200, 300, 400, and 500.
* **X-Axis:**
* The x-axis label is specific to each histogram, indicating the neuron number and the phrase "neuron act.".
* The x-axis scale varies for each histogram, but generally centers around 0.
### Detailed Analysis
**Top Row (LLaMA-2-7B):**
* **3961-th neuron act.:**
* X-axis: Approximately -1 to 1, with tick marks at -1, 0, and 1.
* Blue (true answer) distribution: Peaks around -0.25, extending from approximately -1 to 1. Max height ~325.
* Red (false answer) distribution: Peaks around -0.1, extending from approximately -0.75 to 0.5. Max height ~175.
* **394-th neuron act.:**
* X-axis: Approximately -1 to 1, with tick marks at -1, 0, and 1.
* Blue (true answer) distribution: Peaks around 0, extending from approximately -1 to 1. Max height ~325.
* Red (false answer) distribution: Peaks around 0, extending from approximately -0.75 to 0.75. Max height ~175.
* **490-th neuron act.:**
* X-axis: Approximately -2 to 6, with tick marks at -2, 0, 2, 4, and 6.
* Blue (true answer) distribution: Peaks around 2, extending from approximately -1 to 6. Max height ~325.
* Red (false answer) distribution: Peaks around 2, extending from approximately 0 to 4. Max height ~175.
* **2635-th neuron act.:**
* X-axis: Approximately -1 to 1, with tick marks at -1, 0, and 1.
* Blue (true answer) distribution: Peaks around 0, extending from approximately -1 to 1. Max height ~325.
* Red (false answer) distribution: Peaks around 0, extending from approximately -0.75 to 0.75. Max height ~175.
**Middle Row (LLaMA-3-8B):**
* **3702-th neuron act.:**
* X-axis: Approximately -0.6 to 0.2, with tick marks at -0.6, -0.4, -0.2, 0.0, and 0.2.
* Blue (true answer) distribution: Peaks around -0.3, extending from approximately -0.6 to 0.2. Max height ~425.
* Red (false answer) distribution: Peaks around -0.3, extending from approximately -0.5 to 0.1. Max height ~150.
* **3740-th neuron act.:**
* X-axis: Approximately -0.5 to 0.5, with tick marks at -0.5, 0.0, and 0.5.
* Blue (true answer) distribution: Peaks around 0, extending from approximately -0.5 to 0.5. Max height ~425.
* Red (false answer) distribution: Peaks around 0, extending from approximately -0.4 to 0.4. Max height ~150.
* **1800-th neuron act.:**
* X-axis: Approximately -1.0 to 0.5, with tick marks at -1.0, -0.5, 0.0, and 0.5.
* Blue (true answer) distribution: Peaks around -0.25, extending from approximately -1.0 to 0.5. Max height ~425.
* Red (false answer) distribution: Peaks around -0.25, extending from approximately -0.75 to 0.25. Max height ~150.
* **2082-th neuron act.:**
* X-axis: Approximately -0.5 to 1.0, with tick marks at -0.5, 0.0, 0.5, and 1.0.
* Blue (true answer) distribution: Peaks around 0.1, extending from approximately -0.5 to 1.0. Max height ~425.
* Red (false answer) distribution: Peaks around 0.1, extending from approximately -0.3 to 0.5. Max height ~150.
**Bottom Row (Gemma-7B):**
* **2368-th neuron act.:**
* X-axis: Approximately -0.1 to 0.1, with tick marks at -0.1, 0.0, and 0.1.
* Blue (true answer) distribution: Peaks around 0, extending from approximately -0.1 to 0.1. Max height ~425.
* Red (false answer) distribution: Peaks around 0, extending from approximately -0.05 to 0.05. Max height ~150.
* **1945-th neuron act.:**
* X-axis: Approximately -0.5 to 1.0, with tick marks at -0.5, 0.0, 0.5, and 1.0.
* Blue (true answer) distribution: Peaks around 0.2, extending from approximately -0.5 to 1.0. Max height ~425.
* Red (false answer) distribution: Peaks around 0.2, extending from approximately -0.3 to 0.7. Max height ~150.
* **1758-th neuron act.:**
* X-axis: Approximately -0.50 to 0.50, with tick marks at -0.50, -0.25, 0.00, 0.25, and 0.50.
* Blue (true answer) distribution: Peaks around 0.1, extending from approximately -0.5 to 0.5. Max height ~425.
* Red (false answer) distribution: Peaks around 0.1, extending from approximately -0.25 to 0.3. Max height ~150.
* **719-th neuron act.:**
* X-axis: Approximately -0.1 to 0.1, with tick marks at -0.1, 0.0, and 0.1.
* Blue (true answer) distribution: Peaks around 0, extending from approximately -0.1 to 0.1. Max height ~425.
* Red (false answer) distribution: Peaks around 0, extending from approximately -0.05 to 0.05. Max height ~150.
### Key Observations
* The "true answer" distributions (blue) generally have higher peaks and wider spreads than the "false answer" distributions (red).
* The x-axis scales vary significantly between neurons, suggesting different activation ranges for different neurons.
* The y-axis label changes depending on the language model (LLaMA-2-7B, LLaMA-3-8B, Gemma-7B).
* The distributions appear roughly Gaussian, but with varying means and standard deviations.
### Interpretation
The histograms provide a visual comparison of neuron activation distributions for different language models when processing "true" and "false" answers. The fact that "true answer" distributions tend to have higher peaks and wider spreads suggests that these neurons are more strongly activated and exhibit a wider range of responses when the model is processing correct information. The differences in activation patterns between "true" and "false" answers could be indicative of how the model differentiates between correct and incorrect information internally. The varying x-axis scales highlight the diverse activation ranges of different neurons within the models. The differences in the y-axis label indicate that the number of samples used to generate the histograms is specific to each language model.
DECODING INTELLIGENCE...