\n
## Histograms: Neuron Activation Distributions
### Overview
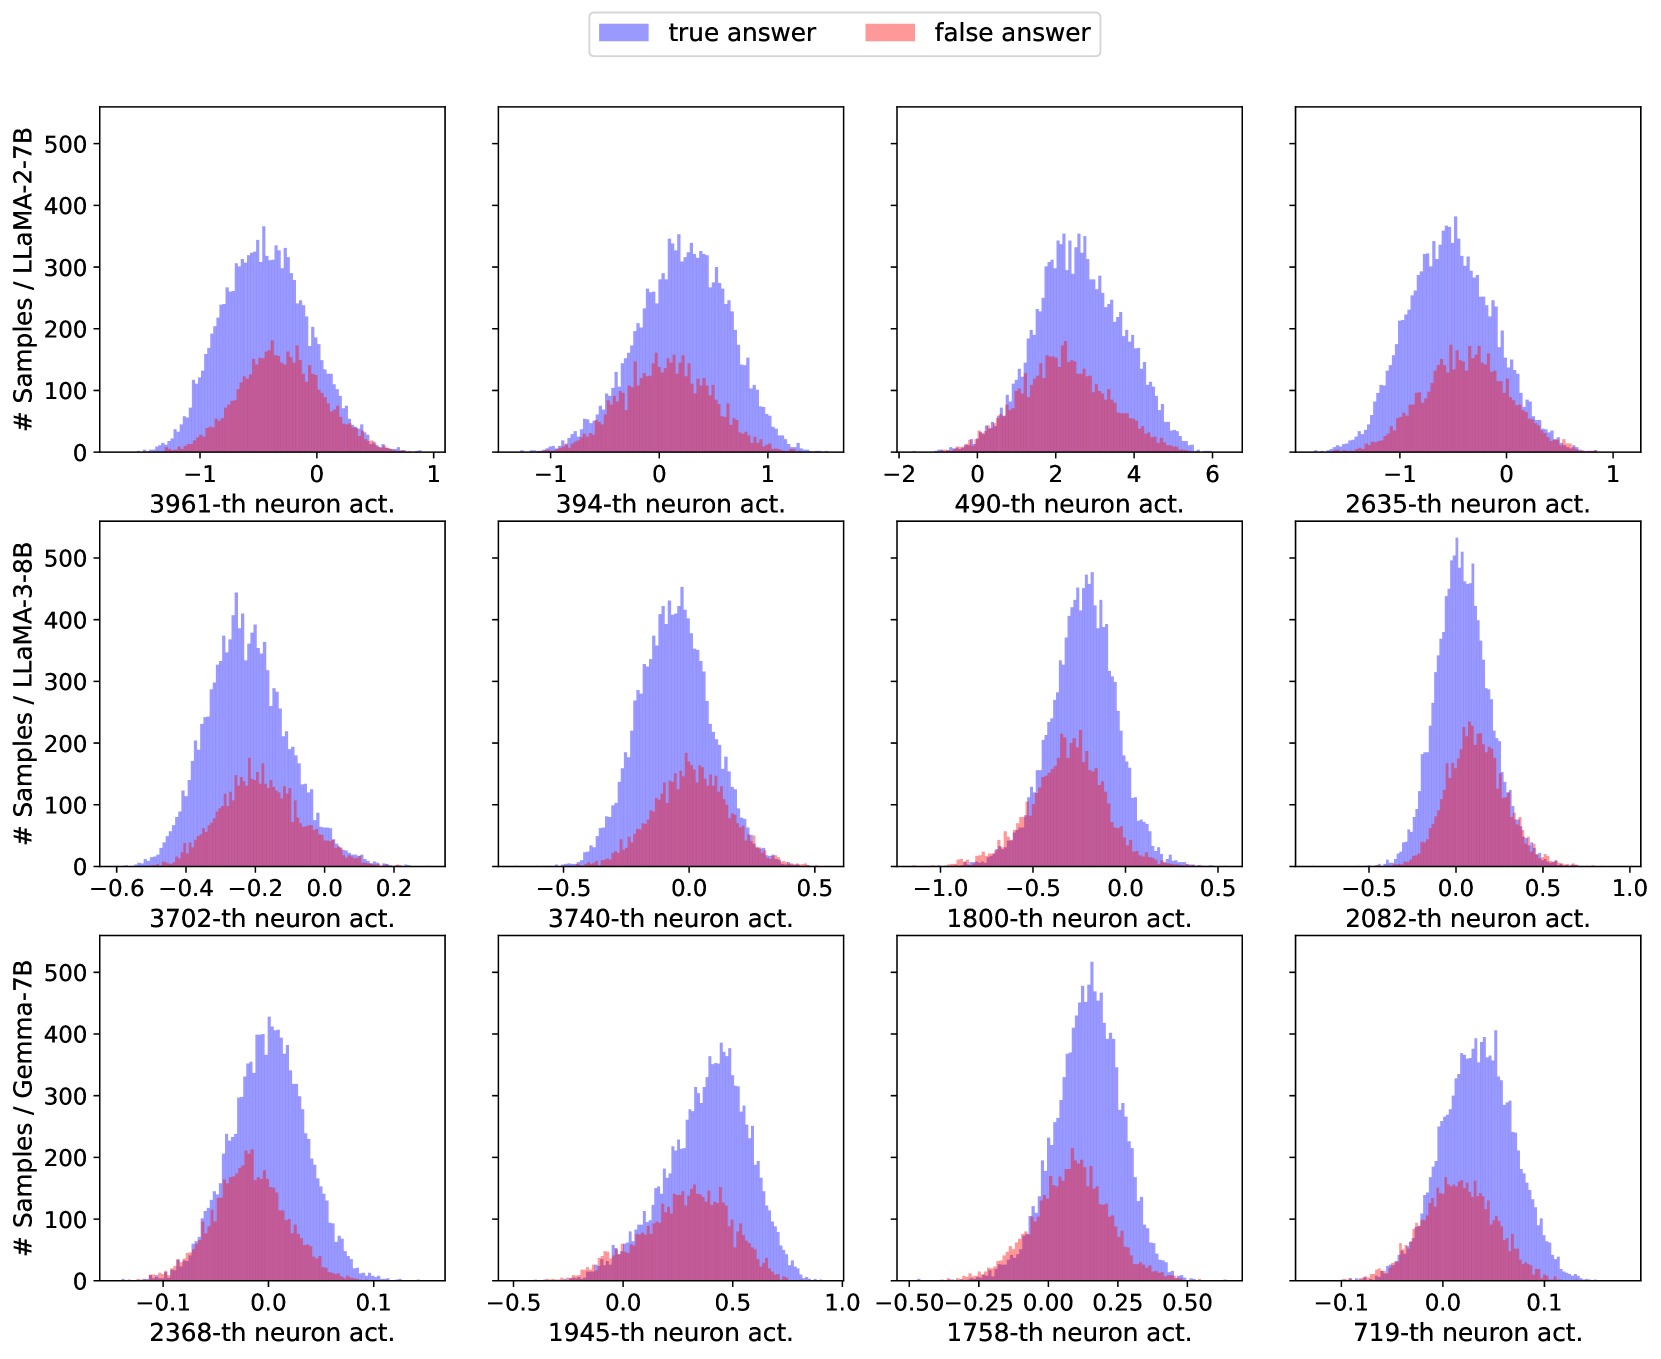
The image presents a 3x4 grid of histograms, visualizing the distribution of neuron activations for different models (Llama-2-7B, Llama-3-8B, and Gemma-7B) and specific neurons within each model. Each histogram represents the activation values for a single neuron, categorized by whether the answer was "true" or "false". The y-axis represents the number of samples, and the x-axis represents the neuron activation value.
### Components/Axes
* **Y-axis (all plots):** "# Samples" - Number of samples, ranging from 0 to approximately 500.
* **X-axis (all plots):** "neuron act." - Neuron activation value. The scale varies for each plot.
* **Legend:**
* Blue: "true answer"
* Red: "false answer"
* **Titles (row-wise):**
* "Llama-2-7B"
* "Llama-3-8B"
* "Gemma-7B"
* **Titles (column-wise):**
* "3961-th neuron act."
* "394-th neuron act."
* "490-th neuron act."
* "2635-th neuron act."
* "3702-th neuron act."
* "3740-th neuron act."
* "1800-th neuron act."
* "2082-th neuron act."
* "2368-th neuron act."
* "1945-th neuron act."
* "1758-th neuron act."
* "719-th neuron act."
### Detailed Analysis or Content Details
**Llama-2-7B (Top Row)**
* **3961-th neuron:** The "true answer" distribution (blue) is centered around -0.2, with a peak at approximately 250 samples. The "false answer" distribution (red) is broader and extends from -1 to 1, with a peak around 0, reaching approximately 150 samples.
* **394-th neuron:** The "true answer" distribution (blue) is centered around -0.5, peaking at approximately 300 samples. The "false answer" distribution (red) is centered around 0.5, peaking at approximately 200 samples.
* **490-th neuron:** The "true answer" distribution (blue) is centered around 1.5, peaking at approximately 250 samples. The "false answer" distribution (red) is centered around -1, peaking at approximately 150 samples. The x-axis ranges from -2 to 6.
* **2635-th neuron:** The "true answer" distribution (blue) is centered around -0.2, peaking at approximately 300 samples. The "false answer" distribution (red) is centered around 0.5, peaking at approximately 200 samples.
**Llama-3-8B (Middle Row)**
* **3702-th neuron:** The "true answer" distribution (blue) is centered around -0.2, peaking at approximately 350 samples. The "false answer" distribution (red) is centered around 0, peaking at approximately 150 samples.
* **3740-th neuron:** The "true answer" distribution (blue) is centered around -0.2, peaking at approximately 300 samples. The "false answer" distribution (red) is centered around 0.2, peaking at approximately 150 samples.
* **1800-th neuron:** The "true answer" distribution (blue) is centered around 0.2, peaking at approximately 300 samples. The "false answer" distribution (red) is centered around -0.2, peaking at approximately 150 samples.
* **2082-th neuron:** The "true answer" distribution (blue) is centered around 0.2, peaking at approximately 300 samples. The "false answer" distribution (red) is centered around 0.5, peaking at approximately 150 samples.
**Gemma-7B (Bottom Row)**
* **2368-th neuron:** The "true answer" distribution (blue) is centered around -0.1, peaking at approximately 350 samples. The "false answer" distribution (red) is centered around 0, peaking at approximately 150 samples.
* **1945-th neuron:** The "true answer" distribution (blue) is centered around -0.3, peaking at approximately 300 samples. The "false answer" distribution (red) is centered around 0.1, peaking at approximately 150 samples.
* **1758-th neuron:** The "true answer" distribution (blue) is centered around 0.3, peaking at approximately 300 samples. The "false answer" distribution (red) is centered around -0.2, peaking at approximately 150 samples.
* **719-th neuron:** The "true answer" distribution (blue) is centered around 0.3, peaking at approximately 300 samples. The "false answer" distribution (red) is centered around 0, peaking at approximately 150 samples.
### Key Observations
* The distributions generally show a separation between "true" and "false" answers, suggesting that neuron activations are correlated with the correctness of the answer.
* The shape and center of the distributions vary significantly between neurons and models.
* Some neurons exhibit a stronger separation between the "true" and "false" distributions than others.
* The x-axis scales vary considerably, indicating different ranges of activation values for different neurons.
### Interpretation
The image demonstrates how neuron activations differ based on whether the model provides a "true" or "false" answer. The separation between the distributions suggests that these neurons are involved in the reasoning process and contribute to the model's ability to distinguish between correct and incorrect responses. The varying shapes and centers of the distributions indicate that different neurons play different roles in this process.
The differences between the models (Llama-2-7B, Llama-3-8B, and Gemma-7B) suggest that the internal representations and activation patterns vary across different architectures and training data. Llama-3-8B appears to have more concentrated distributions, potentially indicating a more efficient use of its neurons. Gemma-7B shows a generally positive activation for "true" answers, while Llama-2-7B shows a more negative activation.
The analysis of individual neuron activations can provide insights into the model's internal workings and help identify neurons that are particularly important for specific tasks. Further investigation could involve analyzing the connections between these neurons and their contribution to the overall model performance.