TECHNICAL ASSET FINGERPRINT
538e49085fb4948f663ad07c
Click to view fullscreen
Press ESC or click to close
FOUND IN PAPERS
EXPERT: healer-alpha-free VERSION 1
RUNTIME: free/openrouter/healer-alpha
INTEL_VERIFIED
## Multi-Panel Histogram Grid: Neuron Activation Distributions for True vs. False Answers
### Overview
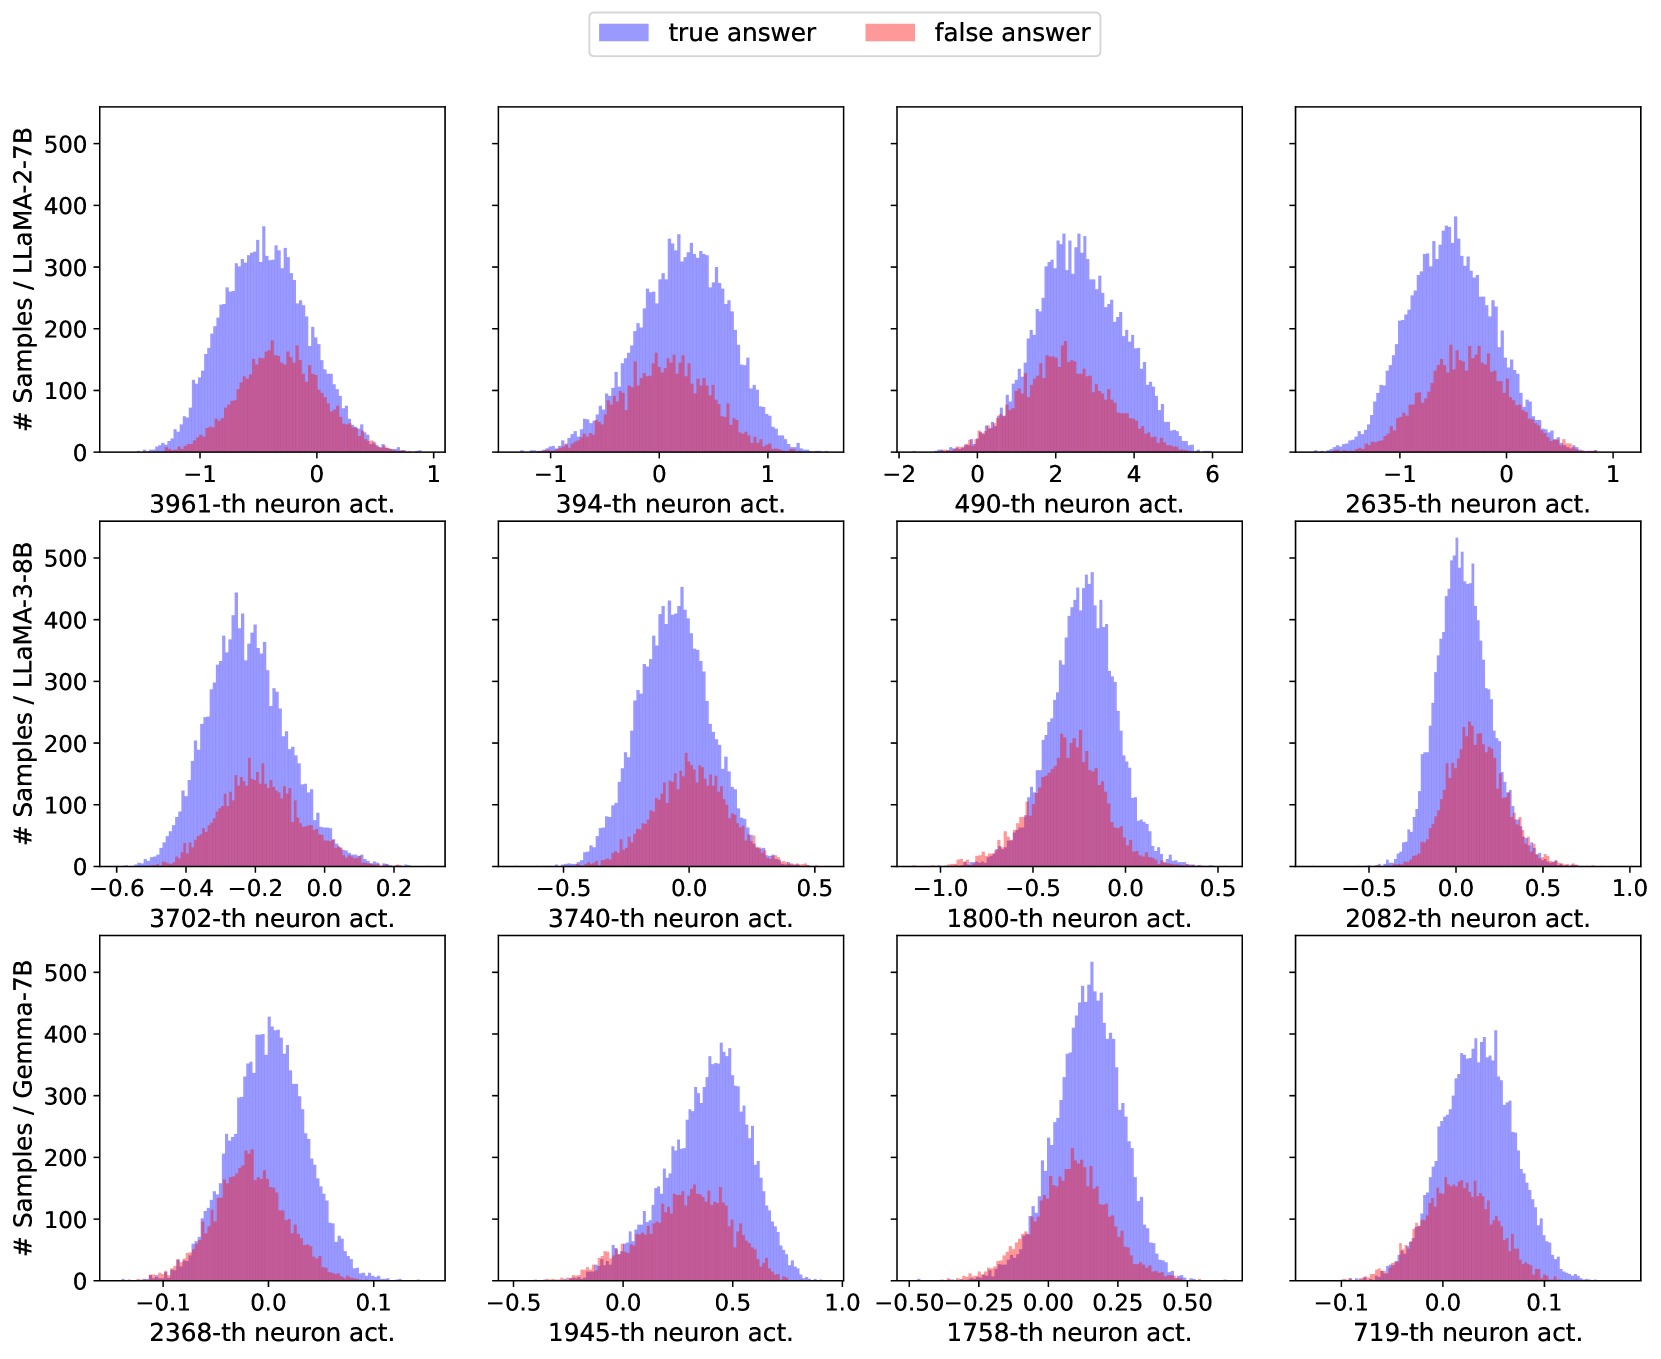
The image displays a 3x4 grid of histograms. Each histogram compares the distribution of activation values for a specific neuron within a specific large language model (LLM) when the model produces a "true answer" versus a "false answer." The top row corresponds to the LLaMA-2-7B model, the middle row to LLaMA-3-8B, and the bottom row to Gemma-7B. Each column represents a different, specifically indexed neuron within that model. The histograms use overlapping semi-transparent bars: blue for "true answer" samples and red for "false answer" samples. The overlapping region appears purple.
### Components/Axes
* **Legend:** Positioned at the top center of the entire figure. It contains two entries:
* A blue square labeled "true answer".
* A red square labeled "false answer".
* **Y-Axis (Common to all plots):** Labeled "# Samples / [Model Name]". The scale is consistent across all plots, ranging from 0 to 500, with major ticks at 0, 100, 200, 300, 400, and 500. This represents the frequency count of samples falling into each activation value bin.
* **X-Axis (Per subplot):** Labeled with the specific neuron index followed by "-th neuron act." (e.g., "3961-th neuron act."). The numerical scale (activation value) varies significantly between subplots.
* **Subplot Grid Structure:**
* **Row 1 (LLaMA-2-7B):** Y-axis label is "# Samples / LLaMA-2-7B".
* **Row 2 (LLaMA-3-8B):** Y-axis label is "# Samples / LLaMA-3-8B".
* **Row 3 (Gemma-7B):** Y-axis label is "# Samples / Gemma-7B".
### Detailed Analysis
**Row 1: LLaMA-2-7B**
1. **3961-th neuron act. (Top-Left):** X-axis range approx. -1.5 to 1.0. Both distributions are centered near 0. The "true answer" (blue) distribution is taller and wider, peaking around 350 samples. The "false answer" (red) distribution is shorter and narrower, peaking around 150 samples. Significant overlap.
2. **394-th neuron act. (Top-Second):** X-axis range approx. -1.0 to 1.5. Distributions are centered slightly above 0. Blue peaks around 350, red around 150. Overlap is substantial.
3. **490-th neuron act. (Top-Third):** X-axis range approx. -2.0 to 6.0. Distributions are centered around 2.0. Blue peaks near 350, red near 150. The "true answer" distribution has a longer tail extending to higher activation values (up to ~6).
4. **2635-th neuron act. (Top-Right):** X-axis range approx. -1.5 to 1.0. Centered near 0. Blue peaks around 350, red around 150. Similar shape to the first plot.
**Row 2: LLaMA-3-8B**
1. **3702-th neuron act. (Middle-Left):** X-axis range approx. -0.6 to 0.2. Centered around -0.2. Blue peaks near 450, red near 150. Distributions are narrower than in LLaMA-2.
2. **3740-th neuron act. (Middle-Second):** X-axis range approx. -0.5 to 0.5. Centered near 0.0. Blue peaks around 450, red around 150.
3. **1800-th neuron act. (Middle-Third):** X-axis range approx. -1.0 to 0.5. Centered around -0.25. Blue peaks near 450, red near 200. The "false answer" distribution is relatively taller here compared to others in this row.
4. **2082-th neuron act. (Middle-Right):** X-axis range approx. -0.5 to 1.0. Centered near 0.0. Blue peaks above 500 (slightly clipped by the top of the axis), red peaks around 200. This shows the highest peak count in the grid.
**Row 3: Gemma-7B**
1. **2368-th neuron act. (Bottom-Left):** X-axis range approx. -0.1 to 0.1. Centered near 0.0. Blue peaks around 400, red around 200. Very narrow activation range.
2. **1945-th neuron act. (Bottom-Second):** X-axis range approx. -0.5 to 1.0. Centered around 0.5. Blue peaks near 350, red near 150. The "true answer" distribution is shifted to the right relative to the "false answer" distribution.
3. **1758-th neuron act. (Bottom-Third):** X-axis range approx. -0.5 to 0.5. Centered near 0.25. Blue peaks near 500, red near 200. High peak count.
4. **719-th neuron act. (Bottom-Right):** X-axis range approx. -0.1 to 0.1. Centered near 0.0. Blue peaks around 350, red around 150. Very narrow range, similar to the first plot in this row.
### Key Observations
1. **Consistent Pattern:** In every single histogram, the distribution for "true answer" (blue) has a higher peak and is generally wider than the distribution for "false answer" (red). This indicates that for these specific neurons, correct model outputs are associated with a broader and more frequent range of activation values.
2. **Overlap:** There is always significant overlap between the two distributions, meaning the activation values alone for these neurons are not perfectly discriminative between true and false answers.
3. **Model Differences:** The x-axis scales (activation value ranges) differ notably between models. LLaMA-2-7B neurons show activations in the range of roughly -2 to +6. LLaMA-3-8B activations are in a tighter range, often between -1 and +1. Gemma-7B activations are the most constrained, often within ±0.1 or ±0.5. This suggests different internal scaling or activation dynamics across model architectures.
4. **Neuron Specificity:** The shape, center, and spread of the distributions are unique to each neuron index, confirming that different neurons encode information differently.
### Interpretation
This visualization is likely from a mechanistic interpretability study aiming to understand how internal neural activations correlate with model correctness. The data suggests that for the selected neurons across three different models, **correct model behavior ("true answer") is associated with more variable and higher-magnitude activation patterns compared to incorrect behavior ("false answer").**
The consistent pattern across diverse models (LLaMA-2, LLaMA-3, Gemma) implies this might be a generalizable phenomenon for certain classes of neurons involved in factual recall or reasoning tasks. However, the significant overlap indicates that while these neurons are *informative*, they are not *deterministic* indicators of truthfulness. A single neuron's activation is likely one signal among many in a distributed representation.
The differences in activation scales between models (LLaMA-2 > LLaMA-3 > Gemma in range) could reflect differences in training recipes, normalization techniques (like LayerNorm), or model size. The narrow ranges in Gemma-7B might indicate a more compressed or regularized activation space.
From a Peircean perspective, this chart provides an *indexical* sign: the activation distribution points to a physical state of the model (neuron firing patterns) that is reliably correlated with a property of its output (truthfulness). The *iconic* similarity of the pattern across models suggests a common underlying computational principle. The *symbolic* interpretation is that these neurons may be part of a circuit that "gates" or "modulates" information flow, where a more active and variable state is permissive for generating correct information.
DECODING INTELLIGENCE...