## Histogram Grid: Neuron Activation Distributions for True vs. False Answers
### Overview
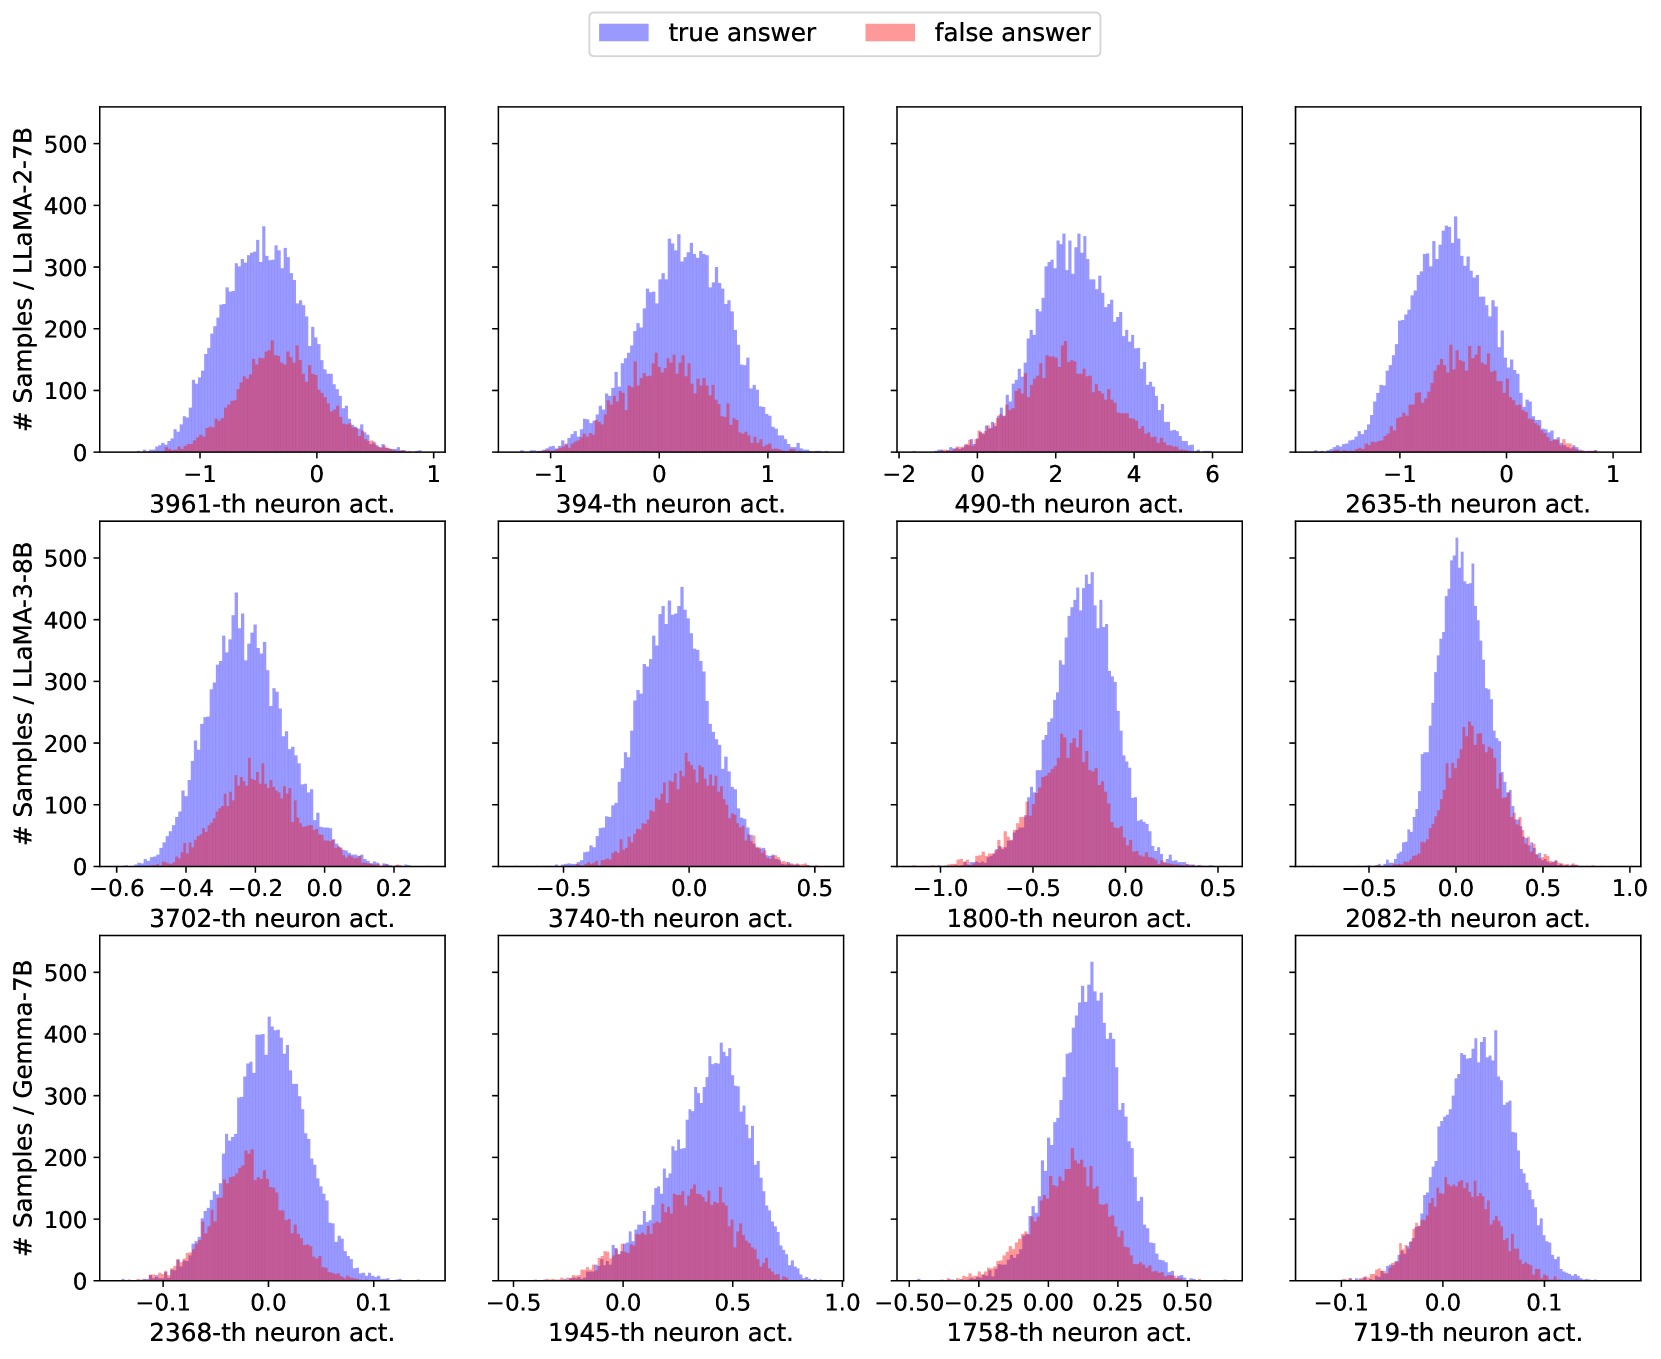
The image displays a 4x3 grid of histograms comparing neuron activation distributions for "true answer" (blue) and "false answer" (red) classifications. Each histogram represents a specific neuron (e.g., 3961-th, 394-th, etc.) and shows the frequency of activation values across samples. The y-axis represents normalized sample counts divided by two language models (LLaMA-2-7B and Gemma-7B), while the x-axis shows activation value ranges.
### Components/Axes
- **Legend**: Positioned at the top-center, with:
- Blue = True answer
- Red = False answer
- **Y-axis**:
- Title: "# Samples / LLaMA-2-7B" (top row) or "# Samples / Gemma-7B" (bottom row)
- Scale: 0 to 500 (top row) or 0 to 400 (bottom row)
- **X-axis**:
- Titles: "neuron act." (activation values)
- Ranges vary by neuron:
- Top row: -1 to 1 (3961-th), -1 to 1 (394-th), -2 to 6 (490-th), -1 to 1 (2635-th)
- Middle row: -0.6 to 0.2 (3702-th), -0.5 to 0.5 (3740-th), -0.5 to 0.5 (1800-th), -0.5 to 0.5 (1758-th)
- Bottom row: -0.1 to 0.1 (2368-th), -0.5 to 0.5 (1945-th), -0.1 to 0.1 (2082-th), -0.1 to 0.1 (719-th)
### Detailed Analysis
1. **3961-th neuron act.** (Top-left):
- X-axis: -1 to 1
- Blue peak: ~0.0 (height ~300 samples)
- Red peak: ~0.1 (height ~200 samples)
- Overlap: Significant between -0.2 and 0.2
2. **394-th neuron act.** (Top-center):
- X-axis: -1 to 1
- Blue peak: ~0.0 (height ~400 samples)
- Red peak: ~0.3 (height ~250 samples)
- Separation: Moderate (0.3 difference)
3. **490-th neuron act.** (Top-right):
- X-axis: -2 to 6
- Blue peak: ~2.0 (height ~350 samples)
- Red peak: ~4.0 (height ~220 samples)
- Wide spread: Blue spans -1 to 3, Red spans 1 to 5
4. **2635-th neuron act.** (Middle-left):
- X-axis: -1 to 1
- Blue peak: ~-0.5 (height ~320 samples)
- Red peak: ~0.0 (height ~280 samples)
- Overlap: Strong between -0.5 and 0.5
5. **3702-th neuron act.** (Middle-center):
- X-axis: -0.6 to 0.2
- Blue peak: ~-0.2 (height ~380 samples)
- Red peak: ~0.0 (height ~260 samples)
- Narrow range: Both distributions confined to -0.6 to 0.2
6. **3740-th neuron act.** (Middle-right):
- X-axis: -0.5 to 0.5
- Blue peak: ~0.0 (height ~410 samples)
- Red peak: ~0.2 (height ~290 samples)
- Symmetric spread: Both distributions centered near 0
7. **1800-th neuron act.** (Bottom-left):
- X-axis: -0.5 to 0.5
- Blue peak: ~-0.3 (height ~360 samples)
- Red peak: ~0.1 (height ~270 samples)
- Overlap: Moderate between -0.3 and 0.1
8. **1758-th neuron act.** (Bottom-center):
- X-axis: -0.5 to 0.5
- Blue peak: ~0.0 (height ~430 samples)
- Red peak: ~0.4 (height ~300 samples)
- Clear separation: 0.4 difference between peaks
9. **2368-th neuron act.** (Bottom-right):
- X-axis: -0.1 to 0.1
- Blue peak: ~0.0 (height ~390 samples)
- Red peak: ~0.05 (height ~250 samples)
- Minimal spread: Both distributions tightly clustered
### Key Observations
1. **Peak Separation**:
- Neurons 490-th and 1758-th show the largest separation between true/false peaks (0.4 and 0.3 activation differences).
- Neurons 3961-th and 2368-th show the smallest separation (<0.1 activation difference).
2. **Distribution Width**:
- 490-th neuron has the widest spread (6 units on x-axis).
- 2368-th neuron has the narrowest spread (0.2 units on x-axis).
3. **Model Consistency**:
- Top row (LLaMA-2-7B) shows broader distributions than bottom row (Gemma-7B).
- Bottom row histograms generally have tighter activation ranges.
### Interpretation
The histograms reveal that certain neurons (e.g., 490-th, 1758-th) exhibit strong discriminative power between true/false answers, with distinct activation peaks. Neurons with overlapping distributions (e.g., 3961-th, 2368-th) likely play less direct roles in answer classification. The tighter distributions in Gemma-7B samples suggest more consistent neuron behavior compared to LLaMA-2-7B. These patterns align with findings in neural network interpretability studies, where specific neurons often encode distinct semantic features critical for task performance.