## Line Chart: Pass Rate vs. RL Training Steps
### Overview
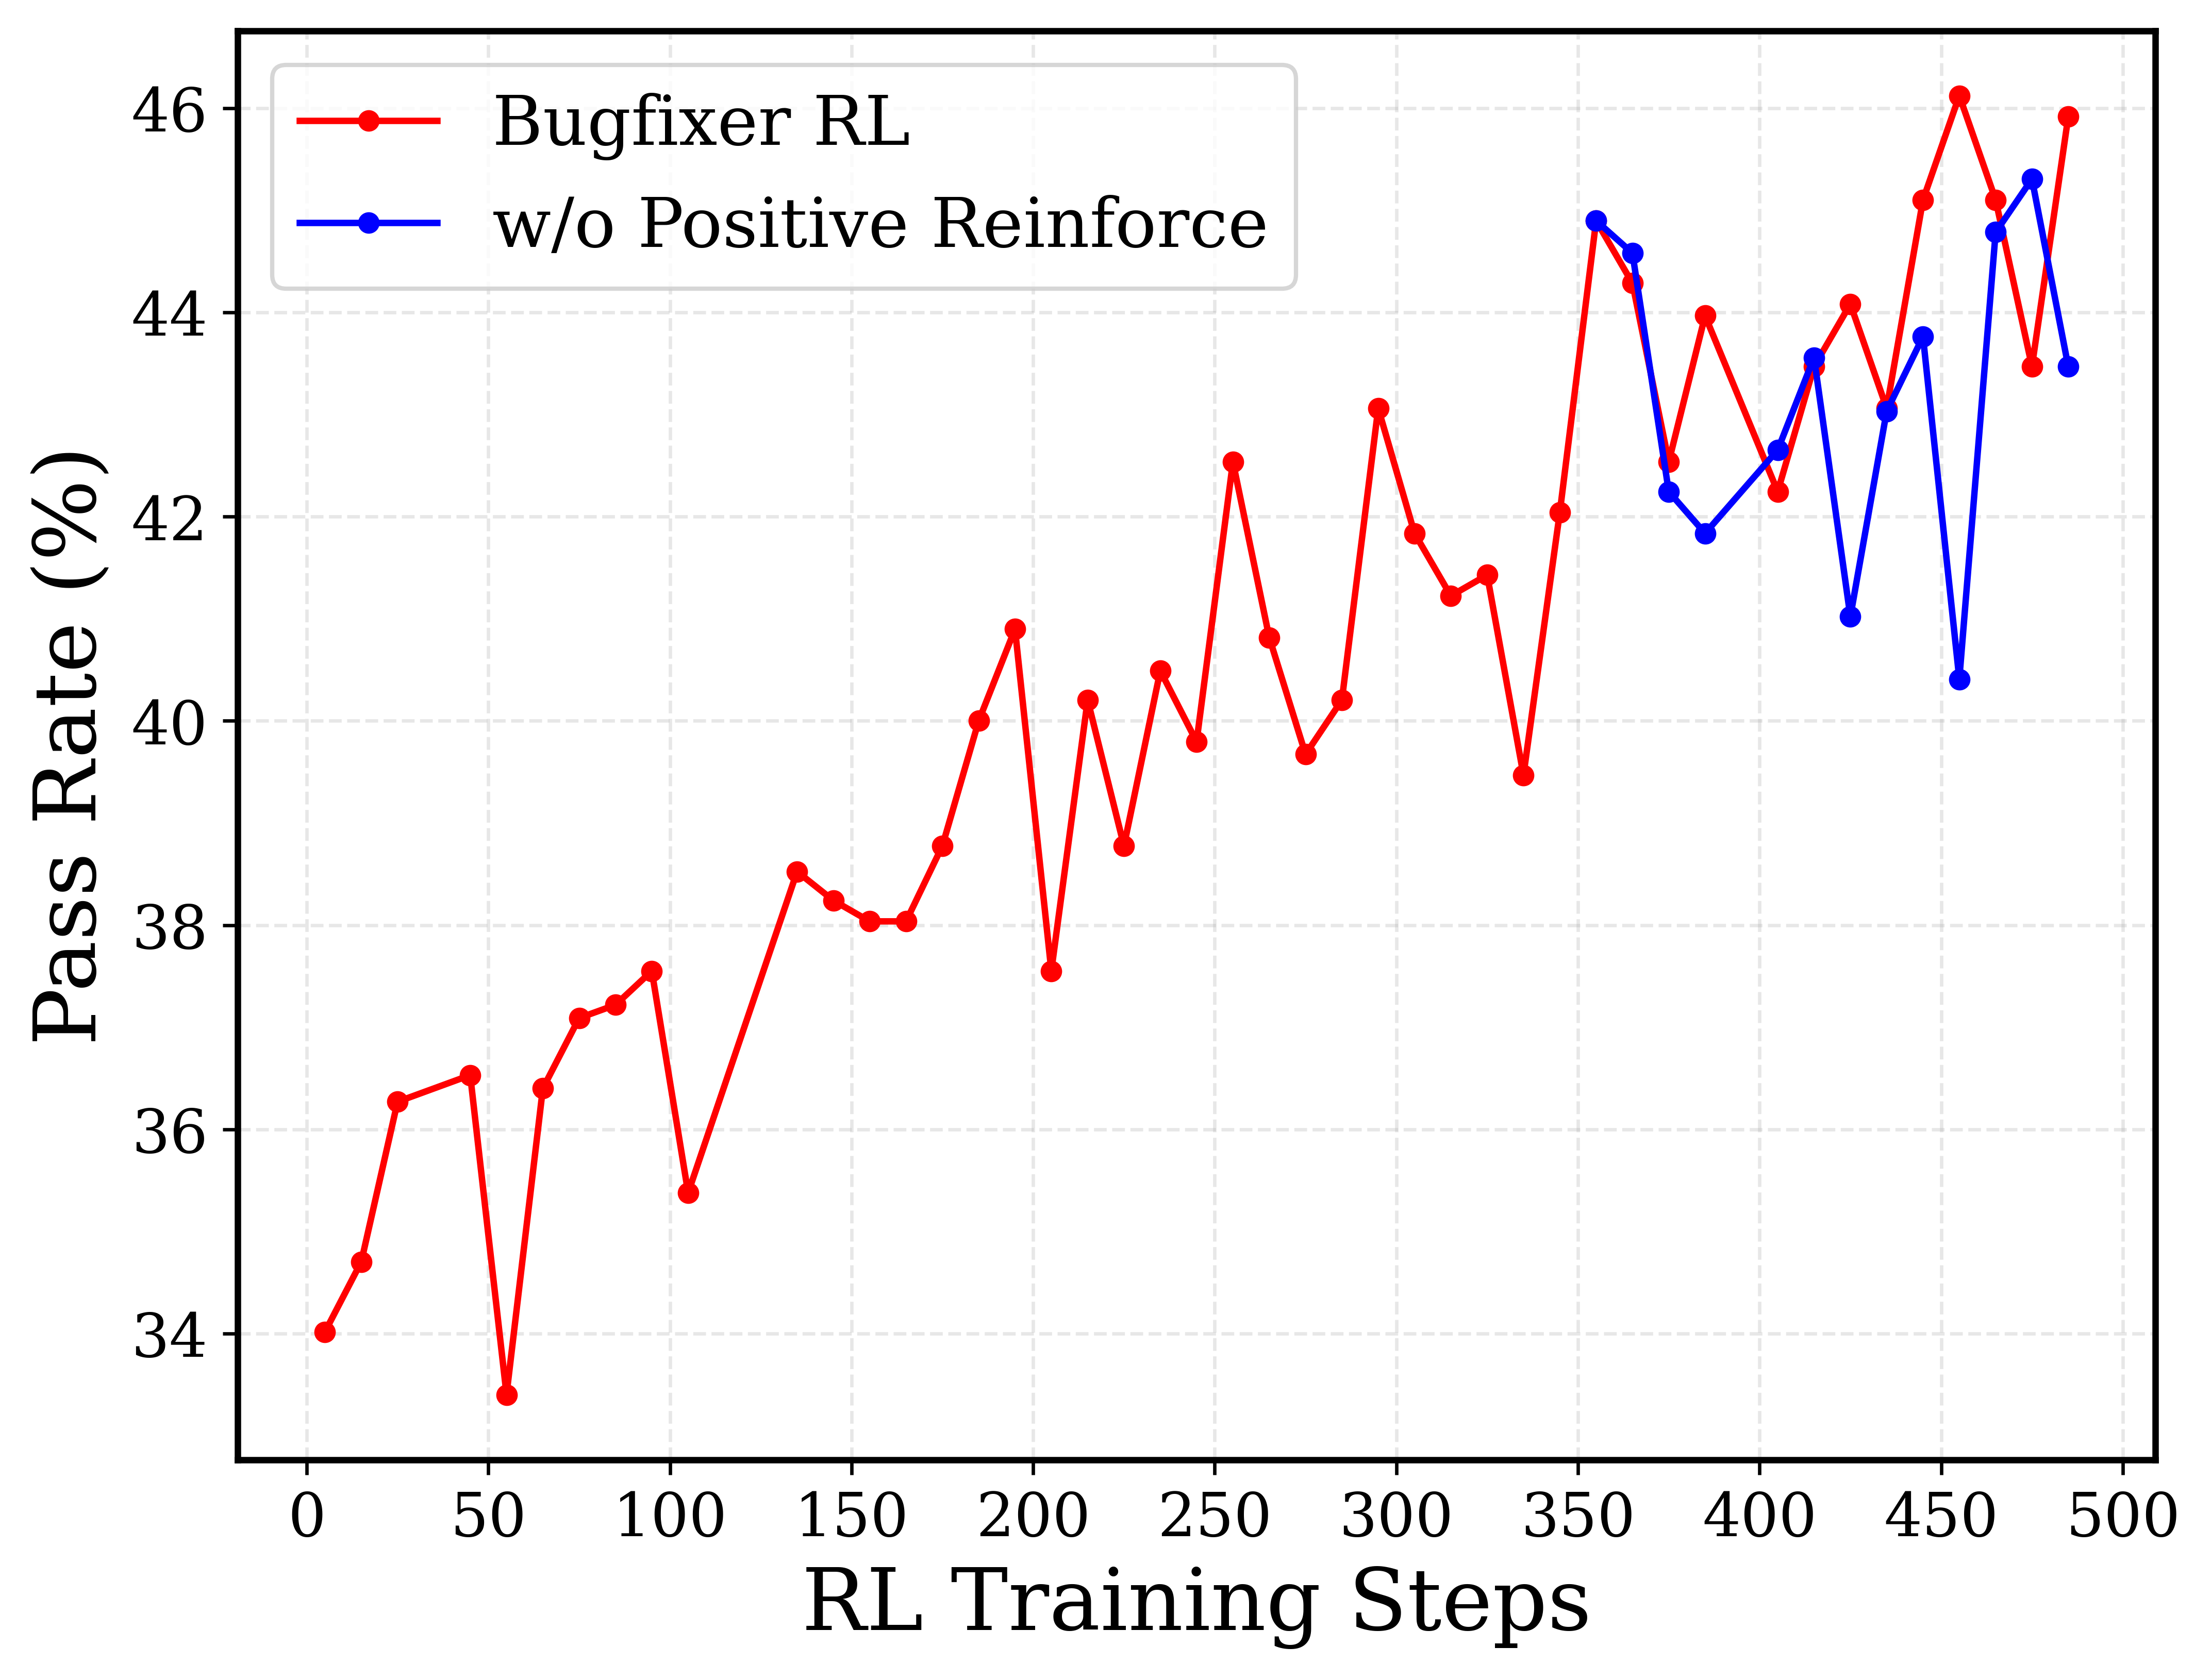
The image is a line chart comparing the pass rate (%) of two reinforcement learning (RL) models: "Bugfixer RL" and "w/o Positive Reinforce" (presumably, without positive reinforcement). The x-axis represents the RL training steps, ranging from 0 to 500. The y-axis represents the pass rate, ranging from 34% to 46%. The chart shows how the pass rate changes with the number of training steps for each model.
### Components/Axes
* **X-axis:** RL Training Steps, ranging from 0 to 500 in increments of 50.
* **Y-axis:** Pass Rate (%), ranging from 34 to 46 in increments of 2.
* **Legend:** Located in the top-left corner.
* Red line with circle markers: "Bugfixer RL"
* Blue line with circle markers: "w/o Positive Reinforce"
### Detailed Analysis
* **Bugfixer RL (Red Line):**
* Trend: Generally increasing with fluctuations.
* Data Points:
* (0, 34)
* (20, 36.3)
* (50, 33.4)
* (75, 37.2)
* (100, 37.5)
* (120, 35.5)
* (150, 38.5)
* (170, 38.1)
* (200, 40.1)
* (210, 37.6)
* (230, 38.9)
* (250, 39.9)
* (270, 42.5)
* (280, 39.7)
* (300, 40.3)
* (325, 41.4)
* (350, 39.5)
* (360, 42.1)
* (380, 44)
* (400, 42.5)
* (425, 43.9)
* (450, 44.1)
* (470, 45.9)
* (480, 44.9)
* (500, 46.1)
* **w/o Positive Reinforce (Blue Line):**
* Trend: Generally increasing with fluctuations, similar to "Bugfixer RL," but with more pronounced drops.
* Data Points:
* (360, 44.8)
* (380, 41.9)
* (400, 42.2)
* (420, 41)
* (440, 43.7)
* (460, 40.4)
* (480, 45.4)
* (500, 43.4)
### Key Observations
* Both models show an increasing trend in pass rate as the number of training steps increases.
* The "Bugfixer RL" model (red line) generally has a higher pass rate than the "w/o Positive Reinforce" model (blue line), especially in the later stages of training (after 400 steps).
* Both models exhibit fluctuations in pass rate, indicating variability in performance during training.
### Interpretation
The data suggests that the "Bugfixer RL" model, which presumably incorporates some bug-fixing mechanism, performs better than the model without positive reinforcement ("w/o Positive Reinforce"). The increasing trend in pass rate for both models indicates that they are learning and improving their performance as they are trained. The fluctuations in pass rate could be due to the stochastic nature of reinforcement learning or the complexity of the task. The "Bugfixer RL" model's consistently higher pass rate after 400 training steps suggests that the bug-fixing mechanism becomes more effective as the model is trained longer. The positive reinforcement seems to be a key component in the Bugfixer RL model, as removing it results in a lower pass rate.