\n
## Line Chart: Pass Rate vs. RL Training Steps
### Overview
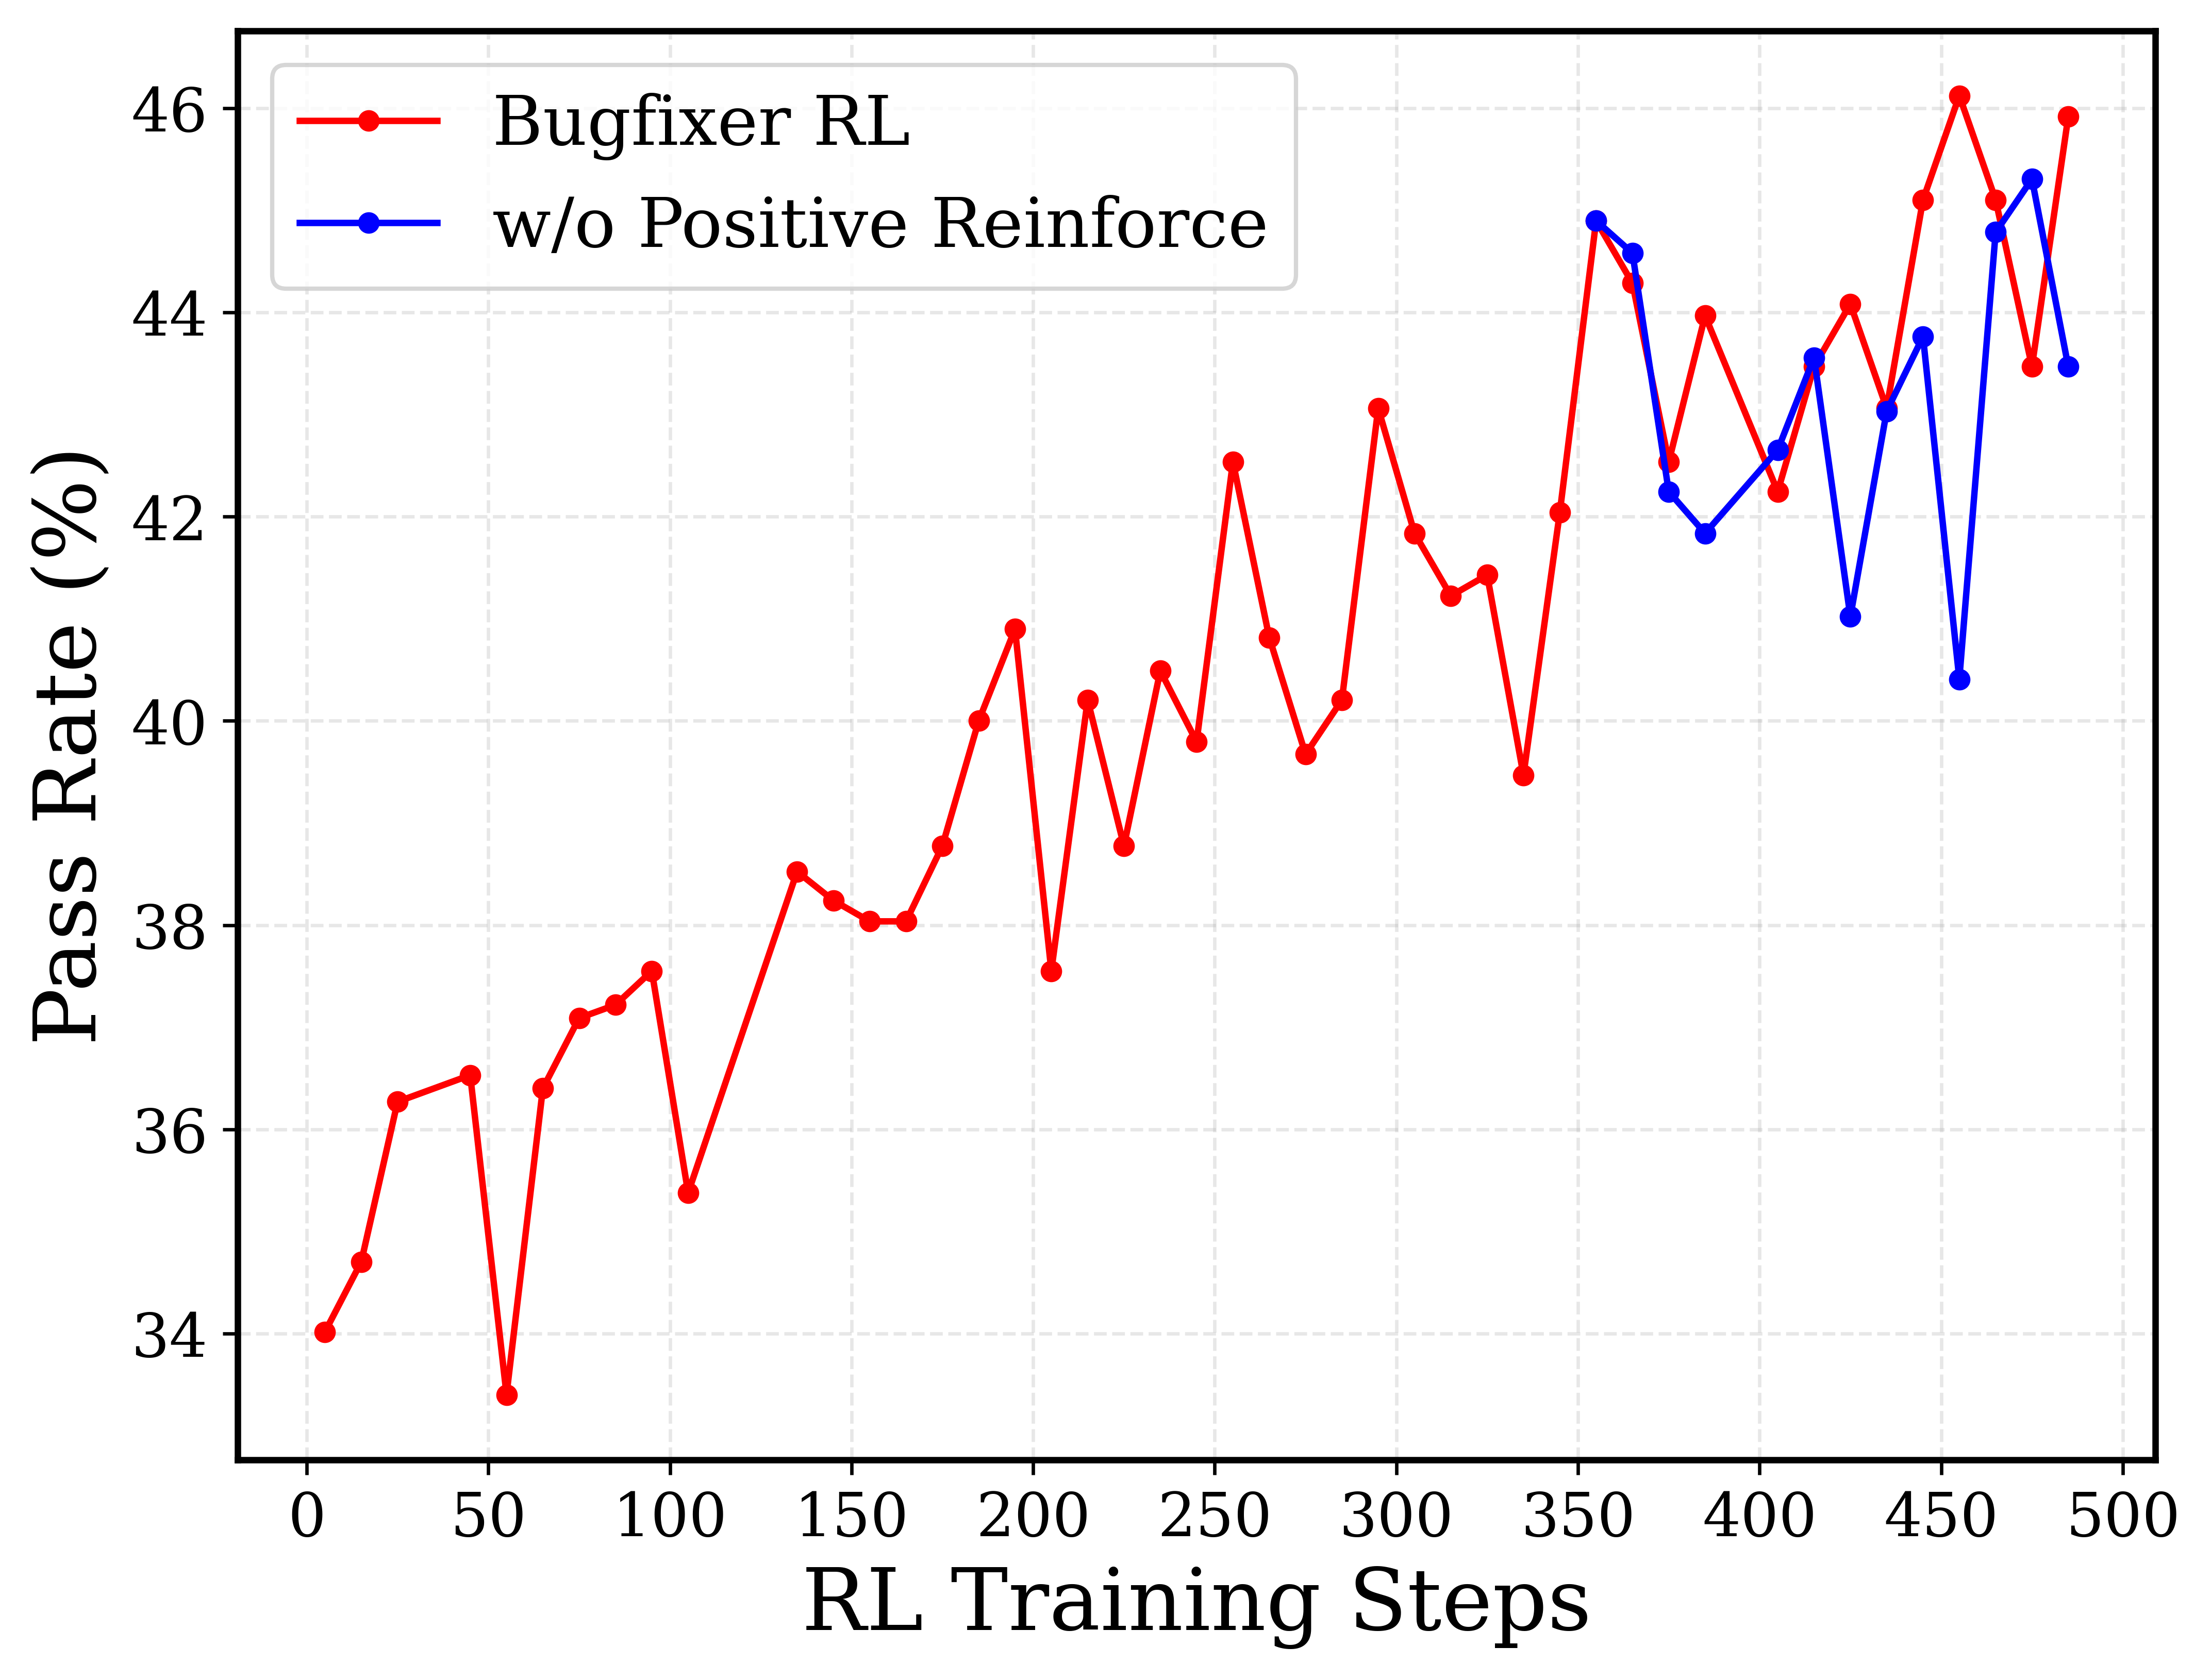
This line chart compares the pass rate of a bug-fixing reinforcement learning (RL) model with and without positive reinforcement, plotted against the number of RL training steps. The chart displays two distinct lines representing the performance of each approach over 500 training steps.
### Components/Axes
* **X-axis:** "RL Training Steps" - Scale ranges from 0 to 500, with tick marks every 50 steps.
* **Y-axis:** "Pass Rate (%)" - Scale ranges from 32% to 46%, with tick marks every 2%.
* **Line 1 (Red):** Labeled "Bugfixer RL" - Represents the pass rate with positive reinforcement.
* **Line 2 (Blue):** Labeled "w/o Positive Reinforce" - Represents the pass rate without positive reinforcement.
* **Legend:** Located in the top-left corner, clearly identifying each line with its corresponding color.
### Detailed Analysis
**Bugfixer RL (Red Line):**
The red line generally exhibits an upward trend, starting at approximately 32% at 0 training steps. It fluctuates, but overall increases to around 46% at 450 training steps, then decreases slightly to approximately 43% at 500 training steps.
* 0 Steps: ~32%
* 50 Steps: ~37%
* 100 Steps: ~38%
* 150 Steps: ~38.5%
* 200 Steps: ~41%
* 250 Steps: ~40.5%
* 300 Steps: ~42%
* 350 Steps: ~44.5%
* 400 Steps: ~43%
* 450 Steps: ~46%
* 500 Steps: ~43%
**w/o Positive Reinforce (Blue Line):**
The blue line also shows fluctuations, starting at approximately 32% at 0 training steps. It generally trends upward, reaching a peak of around 45% at 350 training steps, then declines to approximately 43% at 500 training steps.
* 0 Steps: ~32%
* 50 Steps: ~36%
* 100 Steps: ~38%
* 150 Steps: ~39%
* 200 Steps: ~41%
* 250 Steps: ~41.5%
* 300 Steps: ~43%
* 350 Steps: ~45%
* 400 Steps: ~43%
* 450 Steps: ~43.5%
* 500 Steps: ~43%
### Key Observations
* Both methods start with a similar pass rate (~32%).
* The "Bugfixer RL" (red line) generally achieves a higher pass rate than the "w/o Positive Reinforce" (blue line) after approximately 150 training steps.
* Both lines exhibit significant fluctuations throughout the training process, indicating instability or sensitivity to the training data.
* The performance of both methods appears to plateau or slightly decrease after 400 training steps.
### Interpretation
The data suggests that incorporating positive reinforcement into the reinforcement learning model for bug fixing ("Bugfixer RL") leads to a higher pass rate compared to a model without positive reinforcement. While both methods improve over time, the positive reinforcement approach consistently outperforms the other, particularly after the initial training phase. The fluctuations observed in both lines could be attributed to the stochastic nature of reinforcement learning, the complexity of the bug-fixing task, or the specific training environment. The plateauing of performance after 400 steps might indicate that the models are approaching their maximum achievable performance with the current training setup, or that further training requires adjustments to the learning parameters or training data. The fact that both lines start at the same point suggests that the initial learning phase is similar for both approaches, and the divergence in performance emerges as the models begin to leverage the benefits of positive reinforcement.