## Line Chart: Reinforcement Learning Training Progress
### Overview
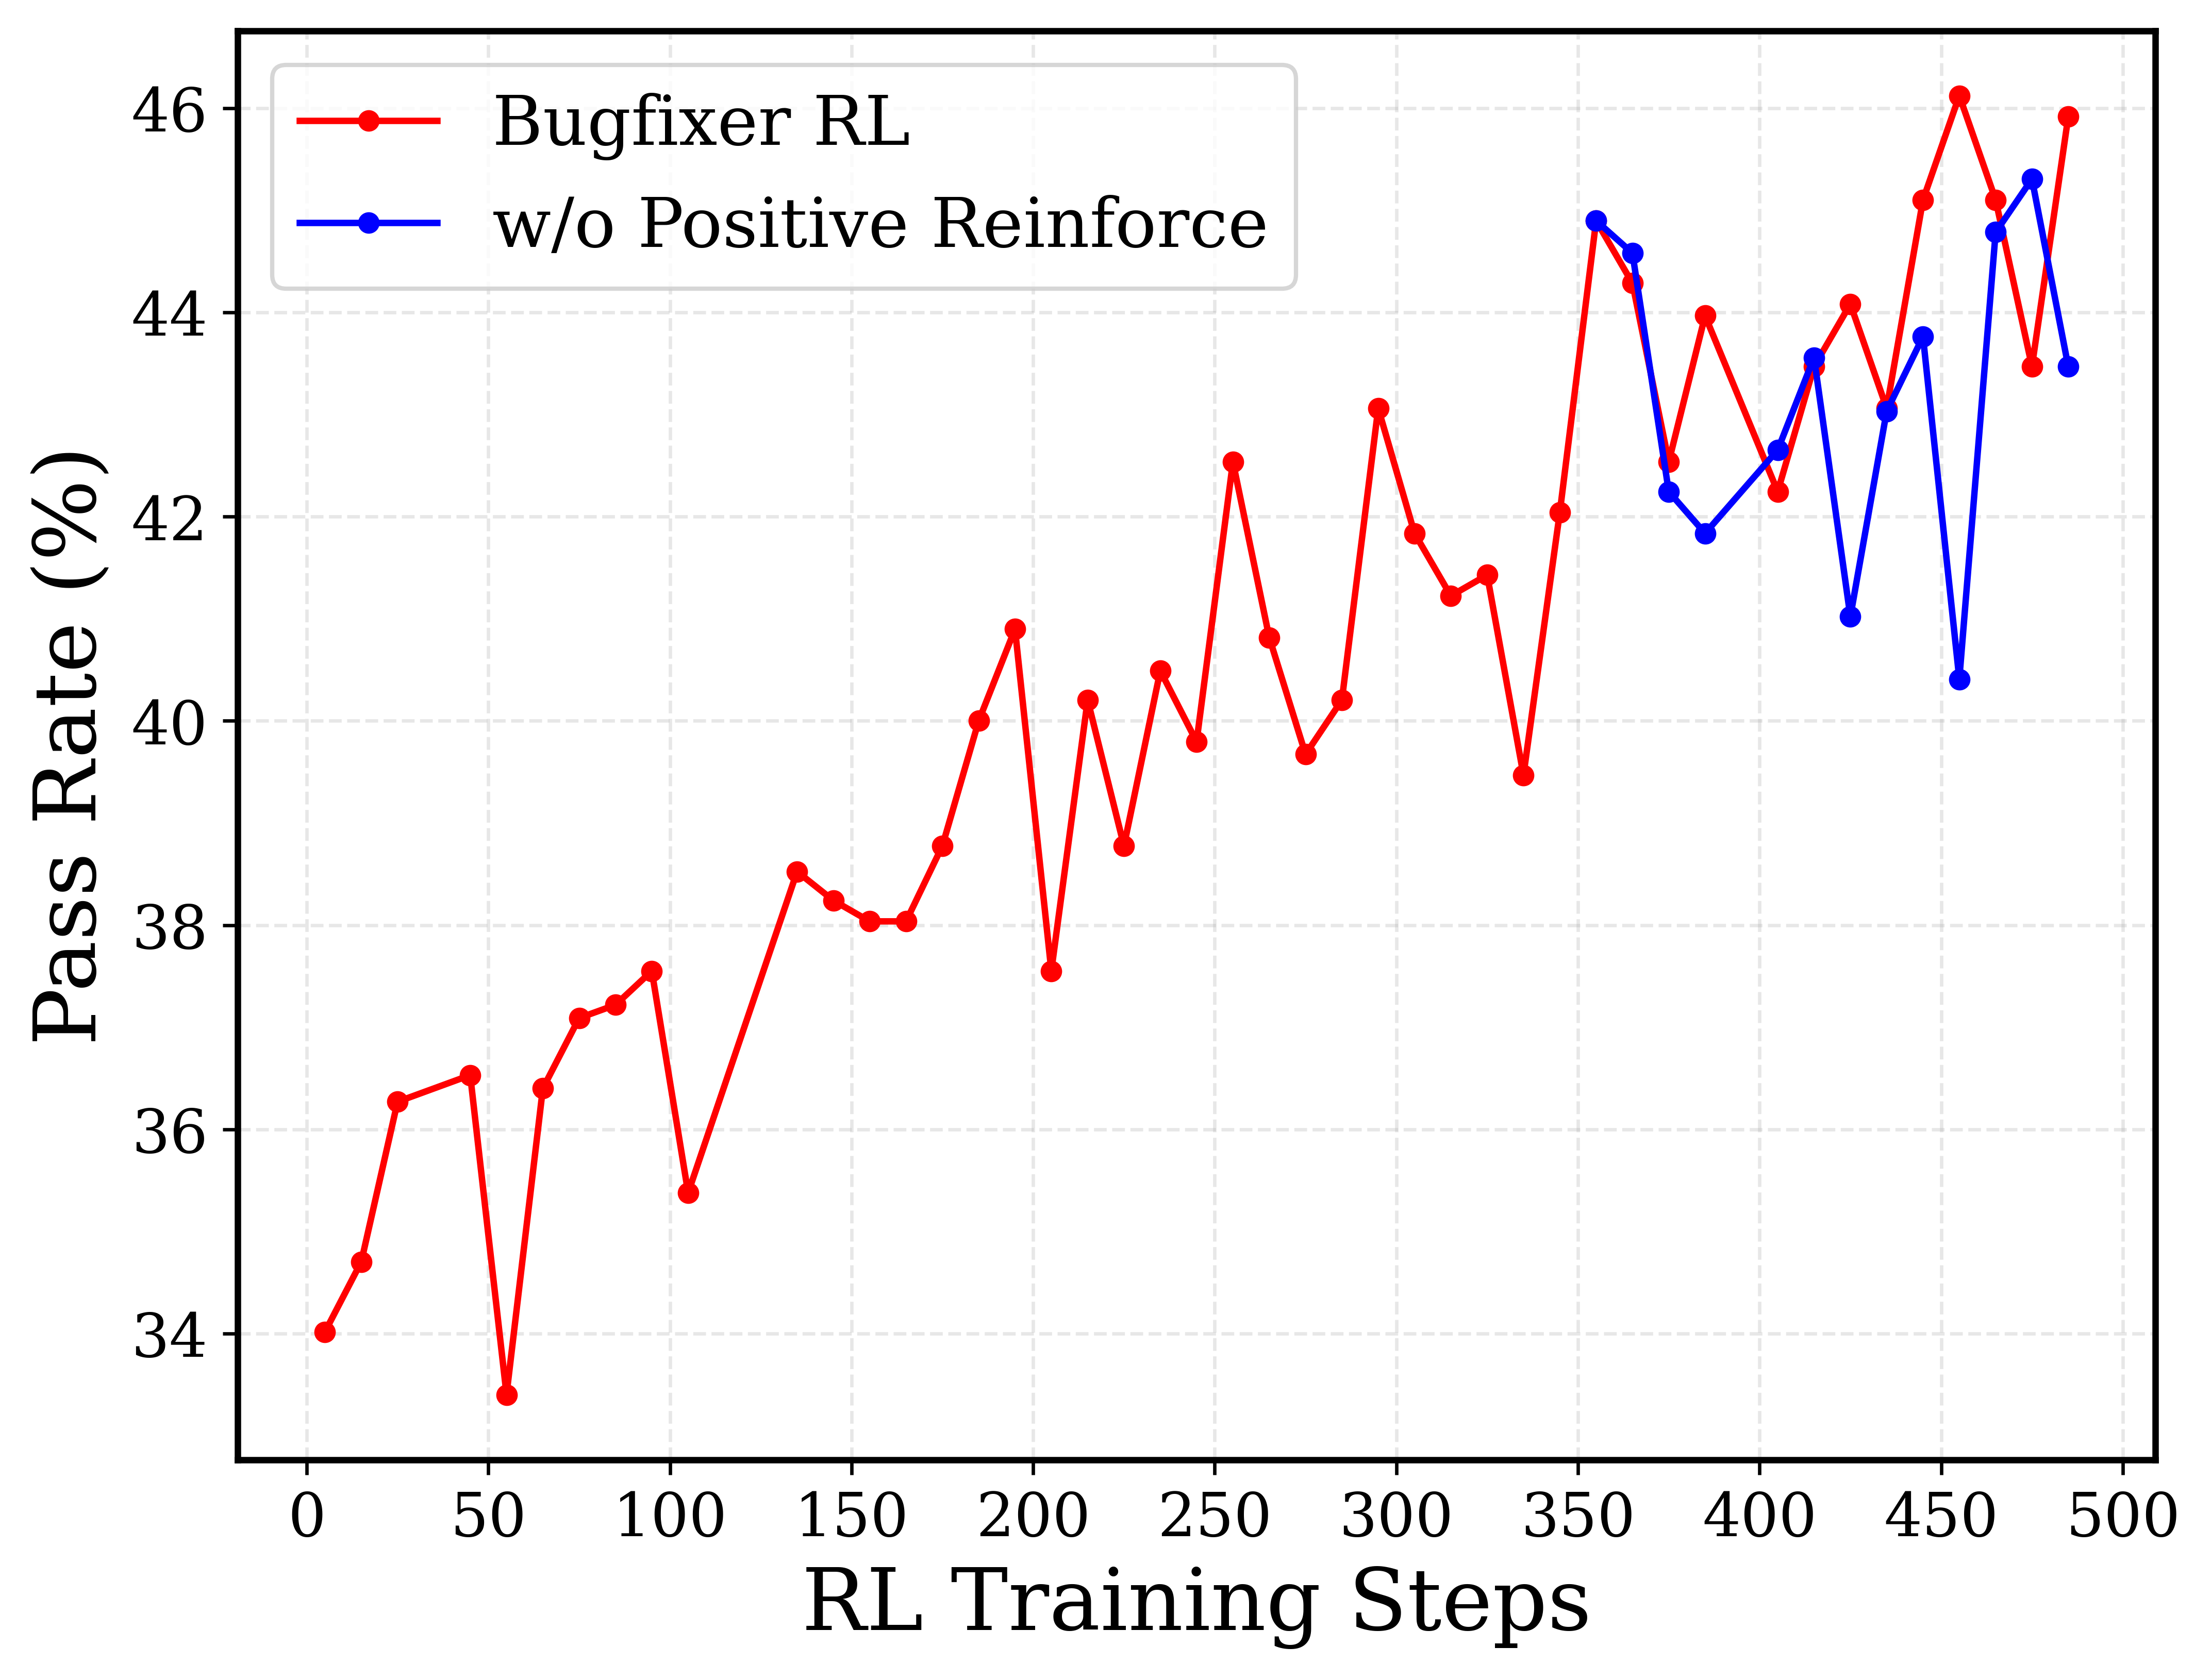
The image is a line chart comparing the performance of two reinforcement learning (RL) models over the course of training. The chart plots "Pass Rate (%)" against "RL Training Steps," showing how the success rate of each model evolves as training progresses. The data suggests an experiment evaluating the impact of a "Positive Reinforce" mechanism on a "Bugfixer RL" model.
### Components/Axes
* **Chart Type:** Line chart with two data series.
* **X-Axis:**
* **Label:** "RL Training Steps"
* **Scale:** Linear, ranging from 0 to 500.
* **Major Tick Marks:** Every 50 steps (0, 50, 100, 150, 200, 250, 300, 350, 400, 450, 500).
* **Y-Axis:**
* **Label:** "Pass Rate (%)"
* **Scale:** Linear, ranging from 34% to 46%.
* **Major Tick Marks:** Every 2 percentage points (34, 36, 38, 40, 42, 44, 46).
* **Legend:**
* **Position:** Top-left corner of the plot area.
* **Series 1:** "Bugfixer RL" - Represented by a **red line** with circular markers.
* **Series 2:** "w/o Positive Reinforce" - Represented by a **blue line** with circular markers. "w/o" is an abbreviation for "without."
### Detailed Analysis
#### Data Series 1: Bugfixer RL (Red Line)
* **Trend:** Shows a general, volatile upward trend over the entire 500-step training period. Performance starts low, experiences significant dips, but ultimately reaches its highest values towards the end of training.
* **Key Data Points (Approximate):**
* Step 0: ~34.0%
* Step 50: ~33.5% (local minimum)
* Step 100: ~37.5%
* Step 150: ~38.0%
* Step 200: ~41.0%
* Step 250: ~42.5%
* Step 300: ~43.0%
* Step 350: ~42.0%
* Step 400: ~44.0%
* Step 450: ~46.0% (global maximum)
* Step 500: ~46.0%
#### Data Series 2: w/o Positive Reinforce (Blue Line)
* **Trend:** This series begins later in the training process (around step 350). It exhibits high volatility within a range of approximately 40% to 45%, without a clear upward or downward trend over its shorter observed period.
* **Key Data Points (Approximate):**
* Step 350: ~45.0%
* Step 375: ~42.0%
* Step 400: ~42.5%
* Step 425: ~41.0%
* Step 450: ~40.5%
* Step 475: ~45.0%
* Step 500: ~43.5%
### Key Observations
1. **Performance Gap:** After the blue line appears at step 350, the red "Bugfixer RL" line is consistently at or above the blue "w/o Positive Reinforce" line for most subsequent steps, with the gap widening significantly at step 450.
2. **Volatility:** Both models show considerable step-to-step volatility in pass rate, indicating that learning progress is not smooth but characterized by peaks and troughs.
3. **Late-Stage Peak:** The "Bugfixer RL" model achieves its highest performance (~46%) in the final quarter of the displayed training (steps 450-500).
4. **Divergence Point:** The most dramatic divergence occurs at step 450, where "Bugfixer RL" peaks at ~46% while "w/o Positive Reinforce" dips to its lowest point in the series at ~40.5%.
### Interpretation
The chart demonstrates the training dynamics of a bug-fixing reinforcement learning agent. The primary comparison is between the full "Bugfixer RL" system and an ablated version lacking a "Positive Reinforce" component.
* **What the data suggests:** The inclusion of the "Positive Reinforce" mechanism appears beneficial for long-term learning. While both models are volatile, the full model (red) not only starts improving earlier but also reaches a higher ultimate performance ceiling. The ablated model (blue), when introduced later, fails to match the peak performance of the full model and shows a significant performance drop at the same step where the full model peaks.
* **Relationship between elements:** The later start of the blue line suggests it may be a control condition or a model variant introduced mid-training for comparison. The fact that the red line is already at a high level (~42%) when the blue line starts (~45%) indicates the "Bugfixer RL" had already learned substantially before the comparison point.
* **Notable anomaly:** The sharp, simultaneous peak (red) and trough (blue) at step 450 is a critical data point. It strongly implies that the "Positive Reinforce" component is crucial for achieving and maintaining high performance at that stage of training, preventing the severe performance collapse seen in its absence. The overall trend argues that positive reinforcement contributes to more robust and higher-performing learning in this specific bug-fixing task.