# Technical Document Analysis of Line Graph
## Chart Overview
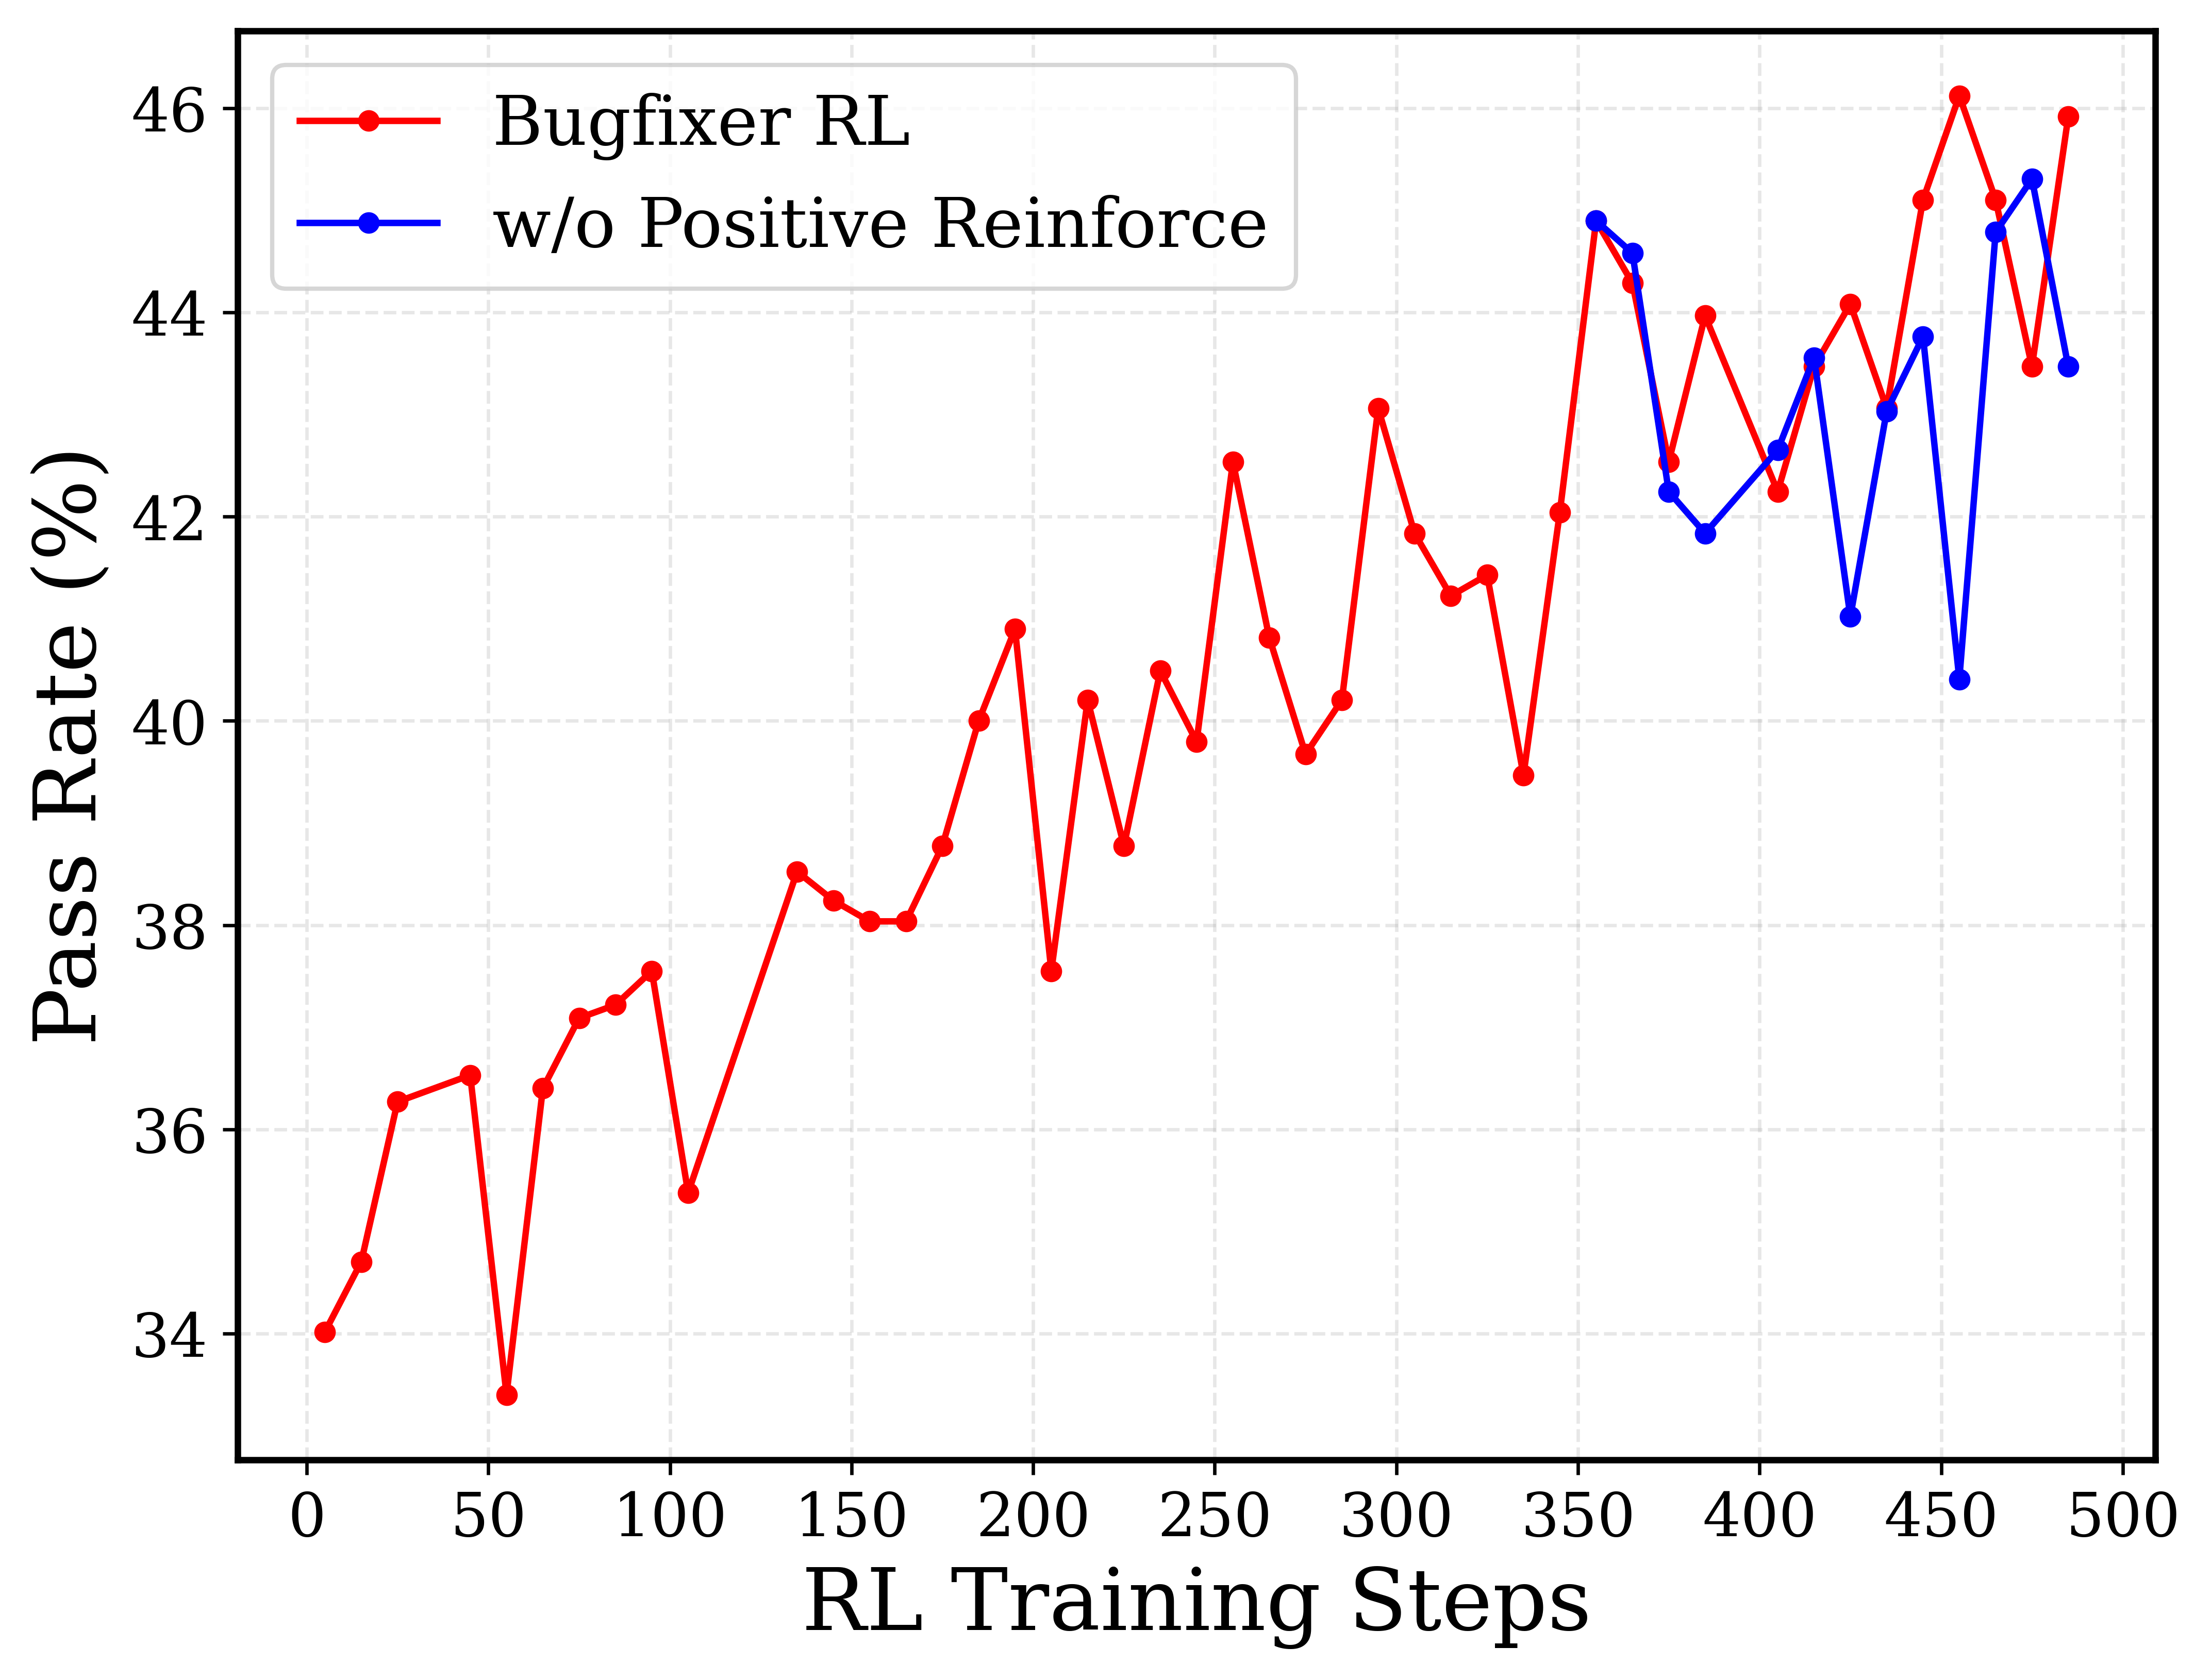
The image depicts a line graph comparing the performance of two reinforcement learning (RL) algorithms over training steps. The graph tracks **Pass Rate (%)** against **RL Training Steps** (0–500). Two data series are represented:
- **Bugfixer RL** (red line)
- **w/o Positive Reinforce** (blue line)
---
## Axis Labels and Markers
- **X-axis**: "RL Training Steps" (0–500, increments of 50)
- **Y-axis**: "Pass Rate (%)" (34%–46%, increments of 2%)
- **Legend**: Located in the top-left corner, with:
- Red: "Bugfixer RL"
- Blue: "w/o Positive Reinforce"
---
## Data Series Analysis
### Bugfixer RL (Red Line)
- **Trend**:
- Starts at **34%** (0 steps).
- Dips to **33.5%** at 50 steps.
- Gradual increase with volatility, peaking at **46%** around 450 steps.
- Final value: **46%** at 500 steps.
- **Key Data Points**:
- 0: 34%
- 50: 33.5%
- 100: 37.5%
- 150: 38.5%
- 200: 37.5%
- 250: 42.5%
- 300: 43.5%
- 350: 45%
- 400: 44%
- 450: 46%
- 500: 46%
### w/o Positive Reinforce (Blue Line)
- **Trend**:
- Starts at **34.5%** (0 steps).
- Dips to **33.8%** at 50 steps.
- Steady upward trajectory, surpassing Bugfixer RL after ~300 steps.
- Final value: **43.5%** at 500 steps.
- **Key Data Points**:
- 0: 34.5%
- 50: 33.8%
- 100: 36.5%
- 150: 38%
- 200: 38.5%
- 250: 40%
- 300: 41.5%
- 350: 45.5%
- 400: 42.5%
- 450: 45%
- 500: 43.5%
---
## Spatial Grounding
- **Legend Position**: Top-left corner (outside the plot area).
- **Data Point Colors**:
- Red matches "Bugfixer RL" (confirmed at all steps).
- Blue matches "w/o Positive Reinforce" (confirmed at all steps).
---
## Trend Verification
- **Bugfixer RL**: Volatile but overall upward trend, with a sharp rise post-300 steps.
- **w/o Positive Reinforce**: Smoother ascent, overtaking Bugfixer RL after ~350 steps.
---
## Component Isolation
1. **Header**: No explicit title; legend serves as primary identifier.
2. **Main Chart**: Line graph with two data series.
3. **Footer**: No additional text or annotations.
---
## Conclusion
The graph demonstrates that **Bugfixer RL** achieves higher pass rates in later training steps, while **w/o Positive Reinforce** shows more consistent improvement over time. Both algorithms exhibit convergence near 500 steps, with Bugfixer RL marginally outperforming at the final step.