\n
## Chart: Importance Score vs. Reasoning Step
### Overview
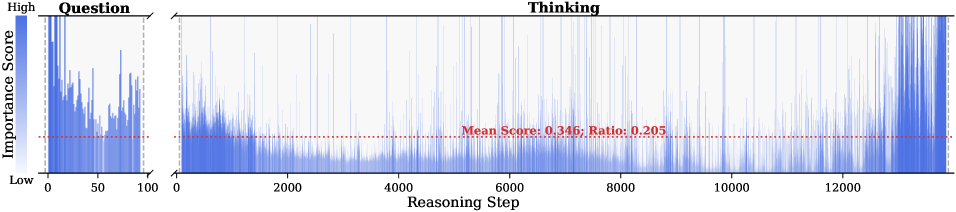
The image presents a chart visualizing the "Importance Score" across "Reasoning Steps". The chart appears to represent the importance of each step in a reasoning process, potentially in the context of a question-answering or problem-solving system. The chart is divided into two sections labeled "Question" and "Thinking".
### Components/Axes
* **X-axis:** "Reasoning Step", ranging from approximately 0 to 12500.
* **Y-axis:** "Importance Score", ranging from "Low" to "High". The scale is not explicitly numerical, but visually represents a continuous range.
* **Sections:** The chart is divided into two sections:
* "Question" - spanning from Reasoning Step 0 to approximately 100.
* "Thinking" - spanning from Reasoning Step 100 to 12500.
* **Horizontal Line:** A dashed red horizontal line is present, labeled "Mean Score: 0.346; Ratio: 0.205".
* **Color Scale:** A vertical color scale on the left side indicates that darker blue represents a "High" Importance Score, while lighter blue represents a "Low" Importance Score.
### Detailed Analysis
The chart displays a fluctuating Importance Score across Reasoning Steps.
* **Question Section (0-100):** The Importance Score exhibits high variability within the "Question" section. The score fluctuates rapidly between low and high values. There are several peaks of high importance, followed by rapid declines.
* **Thinking Section (100-12500):** The "Thinking" section shows a generally lower and more stable Importance Score compared to the "Question" section. The score fluctuates around the mean score, with many steps having a low importance score. The fluctuations are less dramatic than in the "Question" section.
* **Mean Score:** The mean Importance Score is 0.346, with a ratio of 0.205. The ratio is not defined in the image.
* **Visual Trend:** The overall trend in the "Thinking" section is relatively flat, indicating that most reasoning steps have a similar level of importance.
### Key Observations
* The "Question" section demonstrates significantly higher variability in Importance Score than the "Thinking" section.
* The mean Importance Score is relatively low (0.346), suggesting that most reasoning steps have a limited impact on the overall importance.
* The "Thinking" section is much longer than the "Question" section, indicating that the reasoning process involves a significantly larger number of steps dedicated to "Thinking" compared to "Question".
### Interpretation
The data suggests that the initial "Question" phase involves a more dynamic and variable assessment of importance, potentially reflecting the process of understanding and framing the problem. The subsequent "Thinking" phase, however, is characterized by a more consistent, but generally lower, level of importance for each reasoning step. This could indicate that the initial question is crucial for setting the stage, but the subsequent reasoning steps are more incremental and less individually impactful.
The low mean Importance Score in the "Thinking" phase might suggest that the reasoning process is distributed across many steps, with no single step being overwhelmingly important. Alternatively, it could indicate that the Importance Score metric is not sensitive enough to capture the subtle contributions of individual reasoning steps. The ratio of 0.205 is not explained, but could be a measure of the variance or distribution of importance scores.
The chart provides insights into the dynamics of a reasoning process, highlighting the distinct characteristics of the initial question phase and the subsequent thinking phase. It suggests that understanding the question is critical, but the thinking process is more about consistent, incremental steps.