## Line Chart: Importance Scores Across Question and Reasoning Steps
### Overview
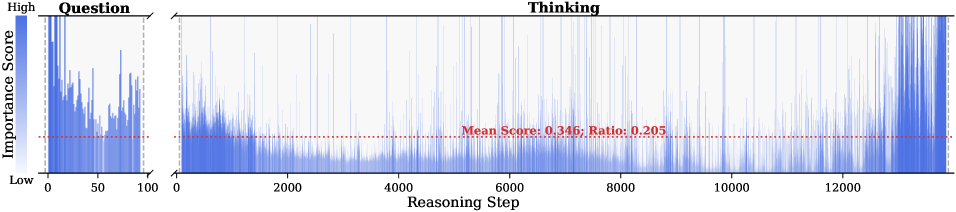
The image displays a line chart comparing importance scores across two phases: "Question" (left) and "Thinking" (right). The y-axis represents "Importance Score" (0–1), while the x-axis tracks "Reasoning Step" (0–12,000). A red dashed line labeled "Mean Score: 0.346; Ratio: 0.205" spans the "Thinking" phase, dividing the chart visually.
---
### Components/Axes
- **Y-Axis (Left)**: "Importance Score" (0 = Low, 1 = High), with a gradient from light to dark blue.
- **X-Axis (Top)**: "Reasoning Step" (0–12,000), split into two segments:
- **Left Segment**: "Question" phase (0–100 steps).
- **Right Segment**: "Thinking" phase (0–12,000 steps).
- **Legend**: Positioned on the far left, with a blue gradient labeled "Importance Score."
- **Red Dashed Line**: Horizontal line at y=0.346, labeled with mean score and ratio.
---
### Detailed Analysis
#### Question Phase (0–100 steps)
- **Trend**:
- High initial scores (dark blue spikes) at steps 0–20.
- Sharp drop to low scores (light blue) around step 50.
- Gradual recovery to moderate scores (mid-blue) by step 100.
- **Key Data Points**:
- Peak at step 0: ~0.8.
- Trough at step 50: ~0.1.
- Recovery to ~0.4 by step 100.
#### Thinking Phase (0–12,000 steps)
- **Trend**:
- Initial moderate scores (~0.3–0.5) in steps 0–2,000.
- Fluctuating scores with sporadic spikes (up to ~0.7) and troughs (~0.1) throughout.
- Final sharp increase to high scores (~0.9–1.0) in the last 500 steps (11,500–12,000).
- **Key Data Points**:
- Mean score: 0.346 (red dashed line).
- Ratio of steps below mean: 0.205 (20.5% of steps).
- Final spike at step 12,000: ~1.0.
---
### Key Observations
1. **Question Phase**: Importance scores are volatile, with a clear dip at step 50 suggesting a critical transition point.
2. **Thinking Phase**:
- Scores are highly variable, with no consistent upward/downward trend.
- Final 500 steps show a dramatic rise, possibly indicating a resolution phase.
3. **Mean vs. Ratio**:
- The mean score (0.346) is below the red dashed line, suggesting most steps cluster around lower importance.
- The ratio (0.205) implies 20.5% of steps fall below the mean, highlighting significant variability.
---
### Interpretation
- **Phase Dynamics**: The "Question" phase exhibits structured volatility, while the "Thinking" phase reflects exploratory reasoning with sporadic insights (spikes) and uncertainty (troughs).
- **Final Spike**: The abrupt rise in the last steps may represent a critical insight or conclusion, contrasting with earlier variability.
- **Mean and Ratio**: The low mean score (0.346) and high ratio (0.205) suggest that most reasoning steps are relatively unimportant, with only a minority driving significant outcomes.
- **Implications**: The chart underscores the non-linear nature of reasoning, where critical steps (e.g., final insights) dominate despite earlier variability. The "Question" phase’s dip at step 50 might indicate a shift from initial assumptions to deeper analysis.