## Horizontal Bar Chart: Solve Rate Comparison
### Overview
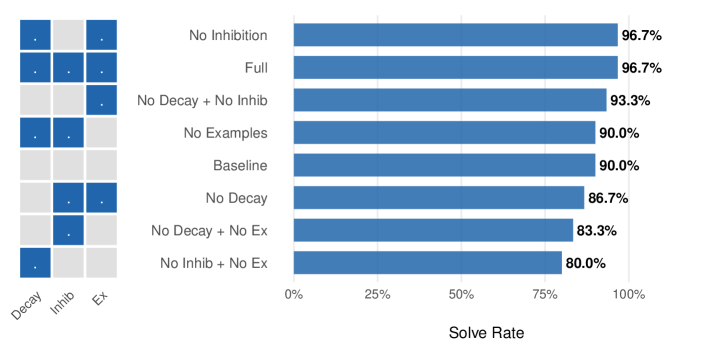
The image presents a horizontal bar chart comparing the "Solve Rate" of different configurations. The configurations are defined by the presence or absence of "Decay", "Inhibition" (Inhib), and "Examples" (Ex). The chart displays the solve rate percentage for each configuration. A matrix on the left indicates the presence (blue) or absence (gray) of each of these three factors.
### Components/Axes
* **Y-axis (Categories):** The Y-axis lists the different configurations:
* No Inhibition
* Full
* No Decay + No Inhib
* No Examples
* Baseline
* No Decay
* No Decay + No Ex
* No Inhib + No Ex
* **X-axis (Solve Rate):** The X-axis represents the "Solve Rate" in percentage, ranging from 0% to 100%. The axis is marked with values 0%, 25%, 50%, 75%, and 100%.
* **Configuration Matrix:** A 3x8 matrix on the left indicates the presence or absence of "Decay", "Inhib", and "Ex" for each configuration. Blue squares indicate presence, and gray squares indicate absence. The rows of the matrix, from top to bottom, correspond to the configurations listed on the Y-axis, from top to bottom. The columns of the matrix, from left to right, correspond to "Decay", "Inhib", and "Ex".
### Detailed Analysis
The following table summarizes the solve rates for each configuration, along with the presence/absence of Decay, Inhibition, and Examples:
| Configuration | Decay | Inhib | Ex | Solve Rate |
| ----------------------- | ----- | ----- | -- | ---------- |
| No Inhibition | Yes | No | Yes | 96.7% |
| Full | Yes | Yes | Yes | 96.7% |
| No Decay + No Inhib | No | No | Yes | 93.3% |
| No Examples | Yes | Yes | No | 90.0% |
| Baseline | Yes | Yes | Yes | 90.0% |
| No Decay | No | Yes | Yes | 86.7% |
| No Decay + No Ex | No | Yes | No | 83.3% |
| No Inhib + No Ex | Yes | No | No | 80.0% |
**Trend Verification:** The solve rates generally decrease as you move down the list of configurations.
### Key Observations
* The "No Inhibition" and "Full" configurations have the highest solve rate (96.7%).
* The "No Inhib + No Ex" configuration has the lowest solve rate (80.0%).
* The presence of both "Inhibition" and "Examples" seems to improve the solve rate compared to configurations where one or both are absent.
* Removing decay seems to lower the solve rate.
### Interpretation
The data suggests that both "Inhibition" and "Examples" play a significant role in achieving a high solve rate. The "Full" configuration, which includes all three factors (Decay, Inhibition, and Examples), performs as well as the "No Inhibition" configuration. The lowest solve rate is observed when both "Inhibition" and "Examples" are absent. This indicates that these two factors are crucial for the system's performance. The presence of decay seems to have a negative impact on the solve rate.