## Horizontal Bar Chart with Feature Matrix: Solve Rate by Condition
### Overview
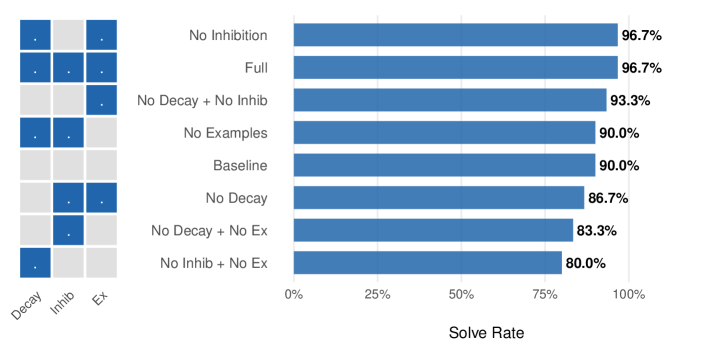
The image displays a horizontal bar chart titled "Solve Rate" on the x-axis, comparing the performance of eight different experimental conditions. To the left of the chart is a small 8x3 grid (matrix) that acts as a visual legend, indicating which features (Decay, Inhibition, Examples) are active or inactive for each condition. The chart shows that conditions with more active features generally achieve higher solve rates.
### Components/Axes
* **Chart Type:** Horizontal Bar Chart.
* **X-Axis:** Labeled "Solve Rate". The scale runs from 0% to 100%, with major tick marks at 0%, 25%, 50%, 75%, and 100%.
* **Y-Axis (Categories):** Lists eight experimental conditions. From top to bottom:
1. No Inhibition
2. Full
3. No Decay + No Inhib
4. No Examples
5. Baseline
6. No Decay
7. No Decay + No Ex
8. No Inhib + No Ex
* **Legend/Feature Matrix:** Positioned to the left of the y-axis labels. It is a grid with 8 rows (matching the conditions) and 3 columns.
* **Column Headers (Bottom):** "Decay", "Inhib", "Ex" (likely short for Examples).
* **Cell Content:** A blue square indicates the feature is **active** for that condition. A light gray square indicates the feature is **inactive**.
* **Data Labels:** The precise solve rate percentage is printed to the right of each bar.
### Detailed Analysis
The following table reconstructs the data from the chart and the feature matrix. The matrix is read row-by-row, corresponding to the condition listed on the same row.
| Condition (Y-Axis Label) | Decay (Feature) | Inhib (Feature) | Ex (Feature) | Solve Rate (Bar Value) |
| :--- | :---: | :---: | :---: | :---: |
| No Inhibition | Active (Blue) | Inactive (Gray) | Active (Blue) | 96.7% |
| Full | Active (Blue) | Active (Blue) | Active (Blue) | 96.7% |
| No Decay + No Inhib | Inactive (Gray) | Inactive (Gray) | Active (Blue) | 93.3% |
| No Examples | Active (Blue) | Active (Blue) | Inactive (Gray) | 90.0% |
| Baseline | Inactive (Gray) | Inactive (Gray) | Inactive (Gray) | 90.0% |
| No Decay | Inactive (Gray) | Active (Blue) | Active (Blue) | 86.7% |
| No Decay + No Ex | Inactive (Gray) | Active (Blue) | Inactive (Gray) | 83.3% |
| No Inhib + No Ex | Active (Blue) | Inactive (Gray) | Inactive (Gray) | 80.0% |
**Trend Verification:** The visual trend of the bars slopes downward from top to bottom. The top two bars ("No Inhibition" and "Full") are the longest and equal. The bars progressively shorten, with the bottom bar ("No Inhib + No Ex") being the shortest. This visual trend is confirmed by the numerical data, which decreases from 96.7% to 80.0%.
### Key Observations
1. **Top Performance:** The highest solve rate (96.7%) is achieved by two conditions: "No Inhibition" (Decay + Examples active) and "Full" (all features active). This suggests that for peak performance, the "Inhibition" feature may be redundant if "Decay" and "Examples" are present.
2. **Baseline Performance:** The "Baseline" condition, where all three features are inactive, achieves a 90.0% solve rate. This is a surprisingly high baseline.
3. **Feature Impact Hierarchy:** Removing features generally reduces performance, but not uniformly.
* Removing "Examples" ("No Examples") drops the rate to 90.0%, matching the Baseline.
* Removing "Decay" ("No Decay") drops it further to 86.7%.
* The lowest performance (80.0%) occurs when both "Inhibition" and "Examples" are removed ("No Inhib + No Ex"), even while "Decay" is active.
4. **Non-Additive Effects:** The impact of features is not simply additive. For example, "No Decay + No Inhib" (only Examples active) scores 93.3%, which is higher than "No Examples" (90.0%) or "No Decay" (86.7%) alone. This indicates complex interactions between the features.
### Interpretation
This chart likely presents ablation study results from a machine learning or cognitive architecture experiment. The "Solve Rate" is the primary performance metric. The three features—Decay, Inhibition, and Examples—are components of a system being tested.
The data suggests that the **Examples** feature is critical for maintaining high performance above the baseline, especially when other features are missing. The **Decay** feature also contributes positively, but its absence is less detrimental than the absence of Examples in most combinations. The **Inhibition** feature appears to have a nuanced role; its presence doesn't hurt performance ("Full" vs. "No Inhibition"), but its absence in combination with the absence of Examples leads to the worst outcome.
The key takeaway is that the system is robust, maintaining a 90% solve rate even with no features active (Baseline). However, to push performance to the mid-90s, the combination of Decay and Examples is essential, with Inhibition providing no additional benefit in that specific context. The lowest performance occurs when the system is stripped of both its memory/reference mechanism (Examples) and its regulatory mechanism (Inhibition), even while a decay process is active. This implies that Examples and Inhibition may serve complementary or stabilizing roles that become crucial when the system is otherwise simplified.