## Bar Chart: Solve Rate by Condition
### Overview
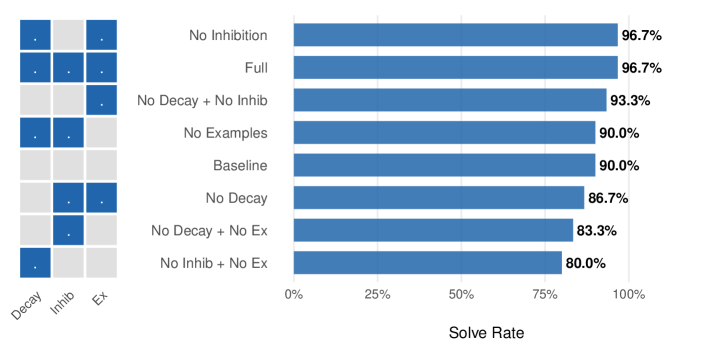
The image is a horizontal bar chart comparing solve rates across eight experimental conditions. The chart includes a legend on the left with three components (Decay, Inhib, Ex) represented by colored squares (blue, gray, white). Bars are uniformly blue, with solve rates labeled as percentages next to each bar.
### Components/Axes
- **Legend**:
- **Decay**: Blue square
- **Inhib**: Gray square
- **Ex**: White square
- **X-axis**: Solve Rate (0% to 100%)
- **Y-axis**: Experimental conditions (listed from top to bottom):
1. No Inhibition
2. Full
3. No Decay + No Inhib
4. No Examples
5. Baseline
6. No Decay
7. No Decay + No Ex
8. No Inhib + No Ex
### Detailed Analysis
- **Bars**: All bars are blue, with solve rates explicitly labeled:
1. No Inhibition: 96.7%
2. Full: 96.7%
3. No Decay + No Inhib: 93.3%
4. No Examples: 90.0%
5. Baseline: 90.0%
6. No Decay: 86.7%
7. No Decay + No Ex: 83.3%
8. No Inhib + No Ex: 80.0%
### Key Observations
1. **Highest Solve Rates**: "No Inhibition" and "Full" conditions both achieve 96.7%, suggesting equivalent performance despite differing component configurations.
2. **Decay/Inhib Interaction**: Removing both Decay and Inhibition ("No Decay + No Inhib") yields 93.3%, outperforming "No Decay" alone (86.7%).
3. **Examples Impact**: "No Examples" and "Baseline" share the same solve rate (90.0%), implying Examples may not independently affect outcomes when other factors are controlled.
4. **Lowest Performance**: "No Inhib + No Ex" (80.0%) underperforms all other conditions, indicating combined exclusion of Inhibition and Examples is detrimental.
### Interpretation
The data suggests that excluding Inhibition or Decay improves solve rates, with the "Full" condition (all components present) matching the performance of "No Inhibition." This paradox implies that Inhibition may act as a redundant or inhibitory factor when Decay is present. The equivalence of "No Examples" and "Baseline" rates hints that Examples might not contribute meaningfully in isolation. The sharp drop in "No Inhib + No Ex" (80.0%) highlights the critical role of at least one component (Decay or Inhibition) in maintaining performance. The uniform blue color of bars suggests the legend’s color coding may represent component presence/absence rather than bar color variation.