## Scatter Plot: Accuracy vs. Mean Response Length for Different Models
### Overview
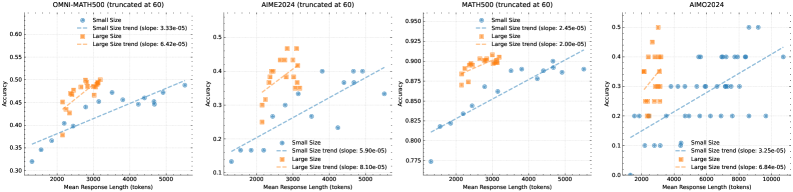
The image presents four scatter plots, each displaying the relationship between accuracy and mean response length (in tokens) for different models: OMNI-MATH500, AIME2024, MATH500, and AIMO2024. Each plot distinguishes between "Small Size" and "Large Size" data points, with trend lines indicating the general direction of each size category. All datasets are truncated at 60.
### Components/Axes
* **X-axis (Horizontal):** Mean Response Length (tokens). The range varies across plots, but generally spans from approximately 1000 to 5000 tokens, with AIMO2024 extending to 10000 tokens.
* **Y-axis (Vertical):** Accuracy. The range varies across plots, but generally spans from 0.0 to 1.0.
* **Data Points:**
* Small Size: Represented by blue circles.
* Large Size: Represented by orange squares.
* **Trend Lines:** Dashed lines indicating the trend for each size category.
* Small Size Trend: Dashed blue line.
* Large Size Trend: Dashed orange line.
* **Titles:** Each plot has a title indicating the model and truncation:
* OMNI-MATH500 (truncated at 60)
* AIME2024 (truncated at 60)
* MATH500 (truncated at 60)
* AIMO2024 (truncated at 60)
* **Legends:** Located in the top-left corner of each plot, indicating the representation of "Small Size" and "Large Size" data points and their corresponding trend lines.
### Detailed Analysis
**1. OMNI-MATH500 (truncated at 60)**
* **Small Size:** The blue circles are scattered. The trend line slopes upward slightly. The slope of the trend line is 3.33e-05. Data points range from approximately (1500, 0.32) to (5200, 0.49).
* **Large Size:** The orange squares are clustered between 2500 and 3200 tokens. The trend line slopes upward. The slope of the trend line is 6.42e-05. Data points range from approximately (2500, 0.43) to (3200, 0.50).
**2. AIME2024 (truncated at 60)**
* **Small Size:** The blue circles are scattered. The trend line slopes upward slightly. The slope of the trend line is 5.90e-05. Data points range from approximately (1500, 0.13) to (4800, 0.40).
* **Large Size:** The orange squares are clustered between 2000 and 3500 tokens. The trend line slopes upward. The slope of the trend line is 8.10e-05. Data points range from approximately (1800, 0.25) to (3200, 0.48).
**3. MATH500 (truncated at 60)**
* **Small Size:** The blue circles are scattered. The trend line slopes upward slightly. The slope of the trend line is 2.45e-05. Data points range from approximately (1500, 0.78) to (5200, 0.94).
* **Large Size:** The orange squares are clustered between 2000 and 3500 tokens. The trend line slopes upward. The slope of the trend line is 2.00e-05. Data points range from approximately (1800, 0.87) to (3200, 0.91).
**4. AIMO2024 (truncated at 60)**
* **Small Size:** The blue circles are scattered. The trend line slopes upward slightly. The slope of the trend line is 3.25e-05. Data points range from approximately (4000, 0.10) to (10000, 0.40).
* **Large Size:** The orange squares are clustered between 1500 and 3500 tokens. The trend line slopes upward. The slope of the trend line is 6.84e-05. Data points range from approximately (1500, 0.00) to (3200, 0.50).
### Key Observations
* For all models, the "Large Size" data points are generally clustered within a smaller range of mean response lengths compared to the "Small Size" data points.
* The trend lines for both "Small Size" and "Large Size" generally slope upward, indicating a positive correlation between mean response length and accuracy.
* The slopes of the trend lines vary across models and size categories, suggesting different relationships between response length and accuracy for each model.
* AIMO2024 has a much wider range of mean response lengths compared to the other models.
### Interpretation
The plots suggest that, in general, longer responses tend to be more accurate, as indicated by the upward-sloping trend lines. However, the clustering of "Large Size" data points within a smaller range of response lengths might indicate a saturation point, where increasing the response length beyond a certain threshold does not significantly improve accuracy. The different slopes and data distributions across models suggest that the relationship between response length and accuracy is model-dependent. The truncation at 60 might influence the results, as it limits the maximum response length considered in the analysis.