## Scatter Plots: Model Accuracy vs. Response Length
### Overview
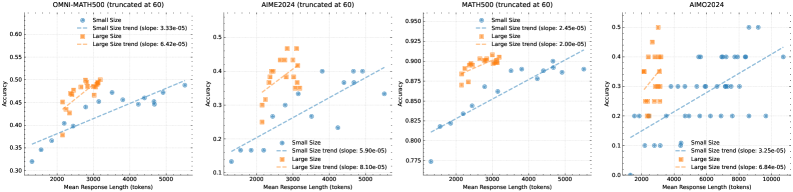
The image presents four scatter plots, each representing the relationship between "Accuracy" and "Mean Response Length (tokens)" for different model sizes ("Small Size" and "Large Size") on four different datasets: OMNI-MATH500, AIME2024, MATH500, and MC2024. Each plot also includes a linear trend line for each model size, with the slope of the line indicated. All plots are truncated at 60.
### Components/Axes
* **X-axis:** "Mean Response Length (tokens)" - Ranges from approximately 0 to 5500 tokens, varying slightly between plots.
* **Y-axis:** "Accuracy" - Ranges from approximately 0.3 to 0.95, varying between plots.
* **Data Series:**
* Small Size (represented by blue dots)
* Large Size (represented by orange dots)
* **Trend Lines:**
* Blue line: Linear trend for Small Size
* Orange line: Linear trend for Large Size
* **Legend:** Located in the top-left corner of each plot, indicating the color-coding for Small and Large sizes, and the slope of the trend lines.
* **Titles:** Each plot has a title indicating the dataset being analyzed (OMNI-MATH500, AIME2024, MATH500, MC2024) and the truncation point (truncated at 60).
### Detailed Analysis or Content Details
**OMNI-MATH500 (truncated at 60)**
* Small Size Trend (slope: 3.33e-05)
* Large Size Trend (slope: 6.42e-05)
* Small Size: Data points are scattered, generally increasing with response length. Approximate values: (1000 tokens, 0.40), (5000 tokens, 0.60).
* Large Size: Data points are also scattered, with a slightly steeper positive trend. Approximate values: (1000 tokens, 0.45), (5000 tokens, 0.70).
**AIME2024 (truncated at 60)**
* Small Size Trend (slope: 9.00e-06)
* Large Size Trend (slope: 0.10e-06)
* Small Size: Data points are more spread out. Approximate values: (1000 tokens, 0.15), (5000 tokens, 0.30).
* Large Size: Data points are clustered, with a very shallow positive trend. Approximate values: (1000 tokens, 0.10), (5000 tokens, 0.15).
**MATH500 (truncated at 60)**
* Small Size Trend (slope: 4.25e-05)
* Large Size Trend (slope: 2.06e-05)
* Small Size: Data points show a clear positive trend. Approximate values: (1000 tokens, 0.78), (5000 tokens, 0.92).
* Large Size: Data points are more concentrated, with a positive trend. Approximate values: (1000 tokens, 0.80), (5000 tokens, 0.88).
**MC2024**
* Small Size Trend (slope: 3.25e-06)
* Large Size Trend (slope: 8.46e-06)
* Small Size: Data points are scattered. Approximate values: (1000 tokens, 0.15), (5000 tokens, 0.25).
* Large Size: Data points are also scattered, with a slightly steeper positive trend. Approximate values: (1000 tokens, 0.10), (5000 tokens, 0.20).
### Key Observations
* The slopes of the trend lines vary significantly between datasets.
* The Large Size model generally exhibits a steeper positive trend than the Small Size model in OMNI-MATH500, MATH500, and MC2024.
* AIME2024 shows a very shallow positive trend for the Large Size model.
* The spread of data points varies between datasets, indicating different levels of consistency in the relationship between accuracy and response length.
### Interpretation
The plots demonstrate the relationship between model size, response length, and accuracy across different mathematical datasets. The positive slopes of the trend lines suggest that, in general, increasing the response length leads to higher accuracy. However, the magnitude of this effect varies significantly depending on the dataset and model size.
The differences in slopes and data point spread suggest that the datasets have different characteristics. Some datasets (e.g., MATH500) show a strong, consistent relationship between response length and accuracy, while others (e.g., AIME2024) exhibit a weaker or more variable relationship.
The fact that the Large Size model often has a steeper slope indicates that it benefits more from increased response length than the Small Size model. This could be because the Large Size model has more capacity to utilize the additional information provided in longer responses.
The truncation at 60 likely refers to a maximum response length considered during evaluation or training. This truncation could influence the observed trends, particularly for datasets where longer responses are more beneficial. The slopes provided are very small, indicating a relatively gradual increase in accuracy with increasing response length.