## Bar Chart: Memory Hit Rate vs. Transformer Layer
### Overview
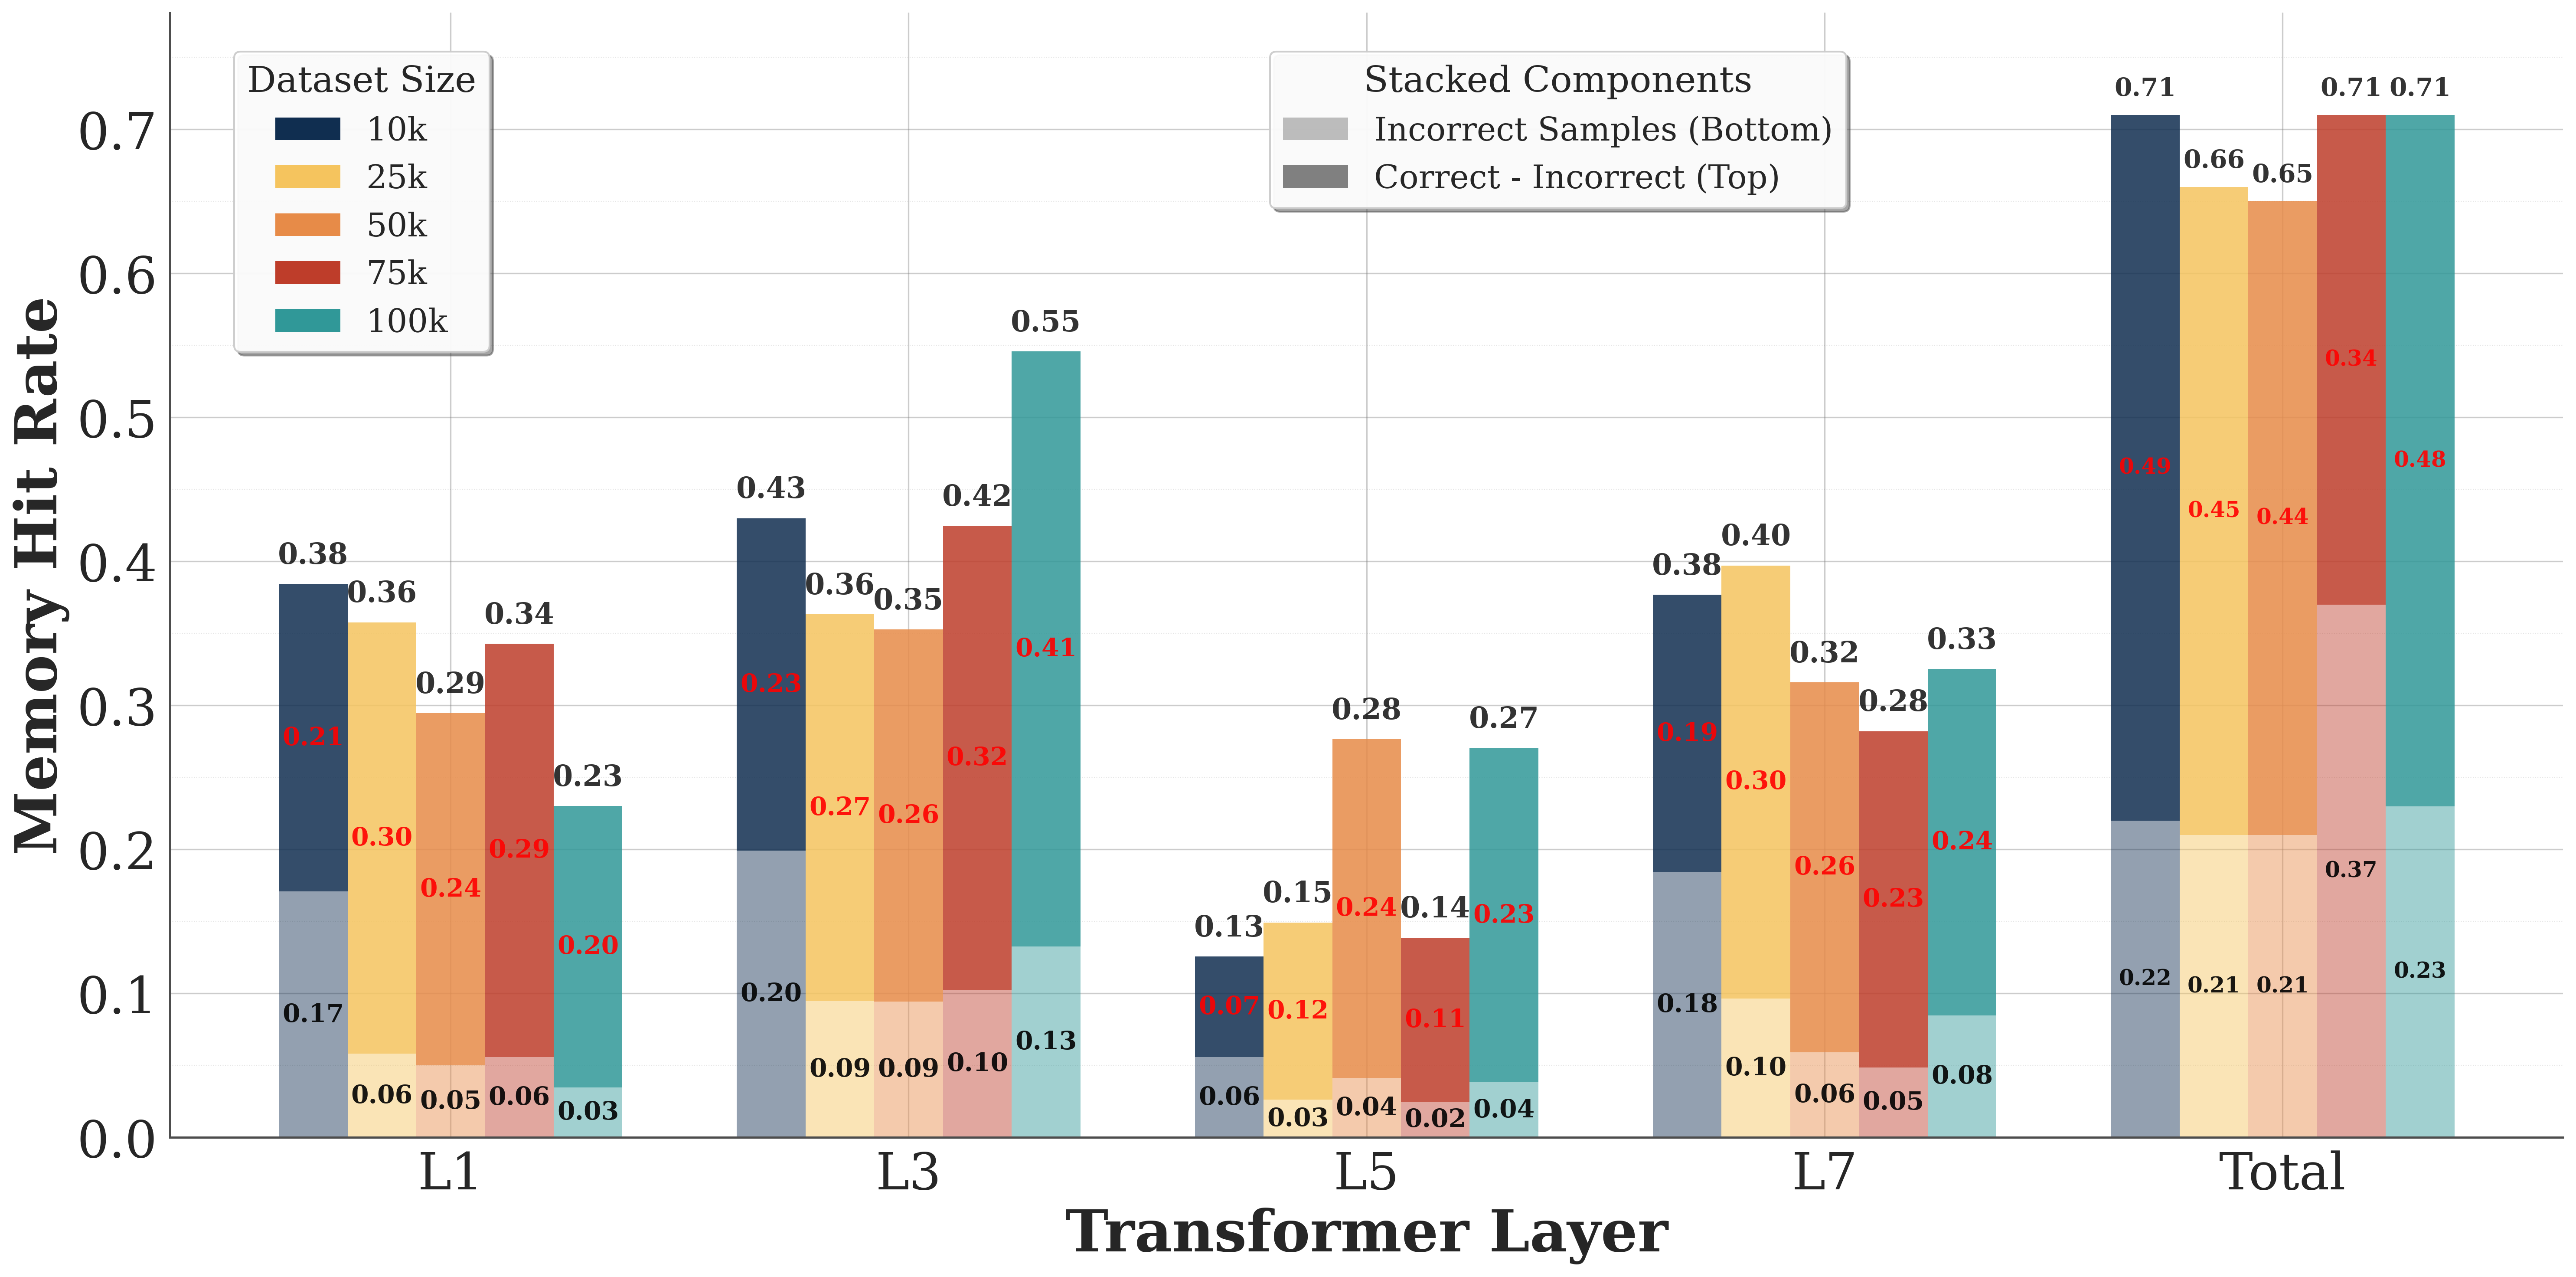
The image is a bar chart comparing the memory hit rate across different transformer layers (L1, L3, L5, L7, and Total) for various dataset sizes (10k, 25k, 50k, 75k, and 100k). The chart also breaks down the memory hit rate into "Incorrect Samples (Bottom)" and "Correct - Incorrect (Top)" components.
### Components/Axes
* **X-axis:** Transformer Layer (L1, L3, L5, L7, Total)
* **Y-axis:** Memory Hit Rate (ranging from 0.0 to 0.7)
* **Legend (Dataset Size):** Located at the top-left of the chart.
* Dark Blue: 10k
* Yellow: 25k
* Orange: 50k
* Red: 75k
* Teal: 100k
* **Legend (Stacked Components):** Located at the top-center of the chart.
* Light Gray: Incorrect Samples (Bottom)
* Dark Gray: Correct - Incorrect (Top)
### Detailed Analysis
**L1 Layer:**
* 10k (Dark Blue): 0.38. Stacked components: Incorrect Samples (Bottom) = 0.17, Correct - Incorrect (Top) = 0.21
* 25k (Yellow): 0.36. Stacked components: Incorrect Samples (Bottom) = 0.06, Correct - Incorrect (Top) = 0.30
* 50k (Orange): 0.29. Stacked components: Incorrect Samples (Bottom) = 0.05, Correct - Incorrect (Top) = 0.24
* 75k (Red): 0.34. Stacked components: Incorrect Samples (Bottom) = 0.06, Correct - Incorrect (Top) = 0.29
* 100k (Teal): 0.23. Stacked components: Incorrect Samples (Bottom) = 0.03, Correct - Incorrect (Top) = 0.20
**L3 Layer:**
* 10k (Dark Blue): 0.43. Stacked components: Incorrect Samples (Bottom) = 0.20, Correct - Incorrect (Top) = 0.23
* 25k (Yellow): 0.36. Stacked components: Incorrect Samples (Bottom) = 0.09, Correct - Incorrect (Top) = 0.27
* 50k (Orange): 0.35. Stacked components: Incorrect Samples (Bottom) = 0.09, Correct - Incorrect (Top) = 0.26
* 75k (Red): 0.42. Stacked components: Incorrect Samples (Bottom) = 0.10, Correct - Incorrect (Top) = 0.32
* 100k (Teal): 0.55. Stacked components: Incorrect Samples (Bottom) = 0.13, Correct - Incorrect (Top) = 0.41
**L5 Layer:**
* 10k (Dark Blue): 0.13. Stacked components: Incorrect Samples (Bottom) = 0.06, Correct - Incorrect (Top) = 0.07
* 25k (Yellow): 0.15. Stacked components: Incorrect Samples (Bottom) = 0.03, Correct - Incorrect (Top) = 0.12
* 50k (Orange): 0.28. Stacked components: Incorrect Samples (Bottom) = 0.04, Correct - Incorrect (Top) = 0.24
* 75k (Red): 0.27. Stacked components: Incorrect Samples (Bottom) = 0.02, Correct - Incorrect (Top) = 0.25
* 100k (Teal): 0.27. Stacked components: Incorrect Samples (Bottom) = 0.04, Correct - Incorrect (Top) = 0.23
**L7 Layer:**
* 10k (Dark Blue): 0.38. Stacked components: Incorrect Samples (Bottom) = 0.18, Correct - Incorrect (Top) = 0.19
* 25k (Yellow): 0.40. Stacked components: Incorrect Samples (Bottom) = 0.10, Correct - Incorrect (Top) = 0.30
* 50k (Orange): 0.32. Stacked components: Incorrect Samples (Bottom) = 0.06, Correct - Incorrect (Top) = 0.26
* 75k (Red): 0.28. Stacked components: Incorrect Samples (Bottom) = 0.05, Correct - Incorrect (Top) = 0.23
* 100k (Teal): 0.33. Stacked components: Incorrect Samples (Bottom) = 0.08, Correct - Incorrect (Top) = 0.24
**Total:**
* 10k (Dark Blue): 0.71. Stacked components: Incorrect Samples (Bottom) = 0.22, Correct - Incorrect (Top) = 0.49
* 25k (Yellow): 0.66. Stacked components: Incorrect Samples (Bottom) = 0.21, Correct - Incorrect (Top) = 0.45
* 50k (Orange): 0.65. Stacked components: Incorrect Samples (Bottom) = 0.21, Correct - Incorrect (Top) = 0.44
* 75k (Red): 0.71. Stacked components: Incorrect Samples (Bottom) = 0.37, Correct - Incorrect (Top) = 0.34
* 100k (Teal): 0.71. Stacked components: Incorrect Samples (Bottom) = 0.23, Correct - Incorrect (Top) = 0.48
### Key Observations
* The "Total" transformer layer generally has the highest memory hit rate across all dataset sizes.
* The 100k dataset size tends to have a higher memory hit rate compared to the other dataset sizes, especially in the L3 and Total layers.
* The L5 layer has the lowest memory hit rate across all dataset sizes.
* The "Correct - Incorrect (Top)" component generally contributes more to the overall memory hit rate than the "Incorrect Samples (Bottom)" component.
### Interpretation
The chart suggests that the memory hit rate varies significantly depending on the transformer layer and the dataset size. The "Total" layer likely represents an aggregated or final layer in the transformer architecture, which benefits from the processing done in the earlier layers (L1, L3, L5, L7), resulting in a higher hit rate. The lower hit rate in the L5 layer could indicate a bottleneck or a less efficient memory access pattern in that specific layer. The higher hit rate for the 100k dataset size might be due to better generalization or more effective caching with larger datasets. The stacked components provide insights into the nature of memory hits, distinguishing between hits related to incorrect samples and hits related to the difference between correct and incorrect samples. This distinction can be valuable for optimizing memory access patterns and improving the overall performance of the transformer model.