## Stacked Bar Chart: Memory Hit Rate vs. Transformer Layer & Dataset Size
### Overview
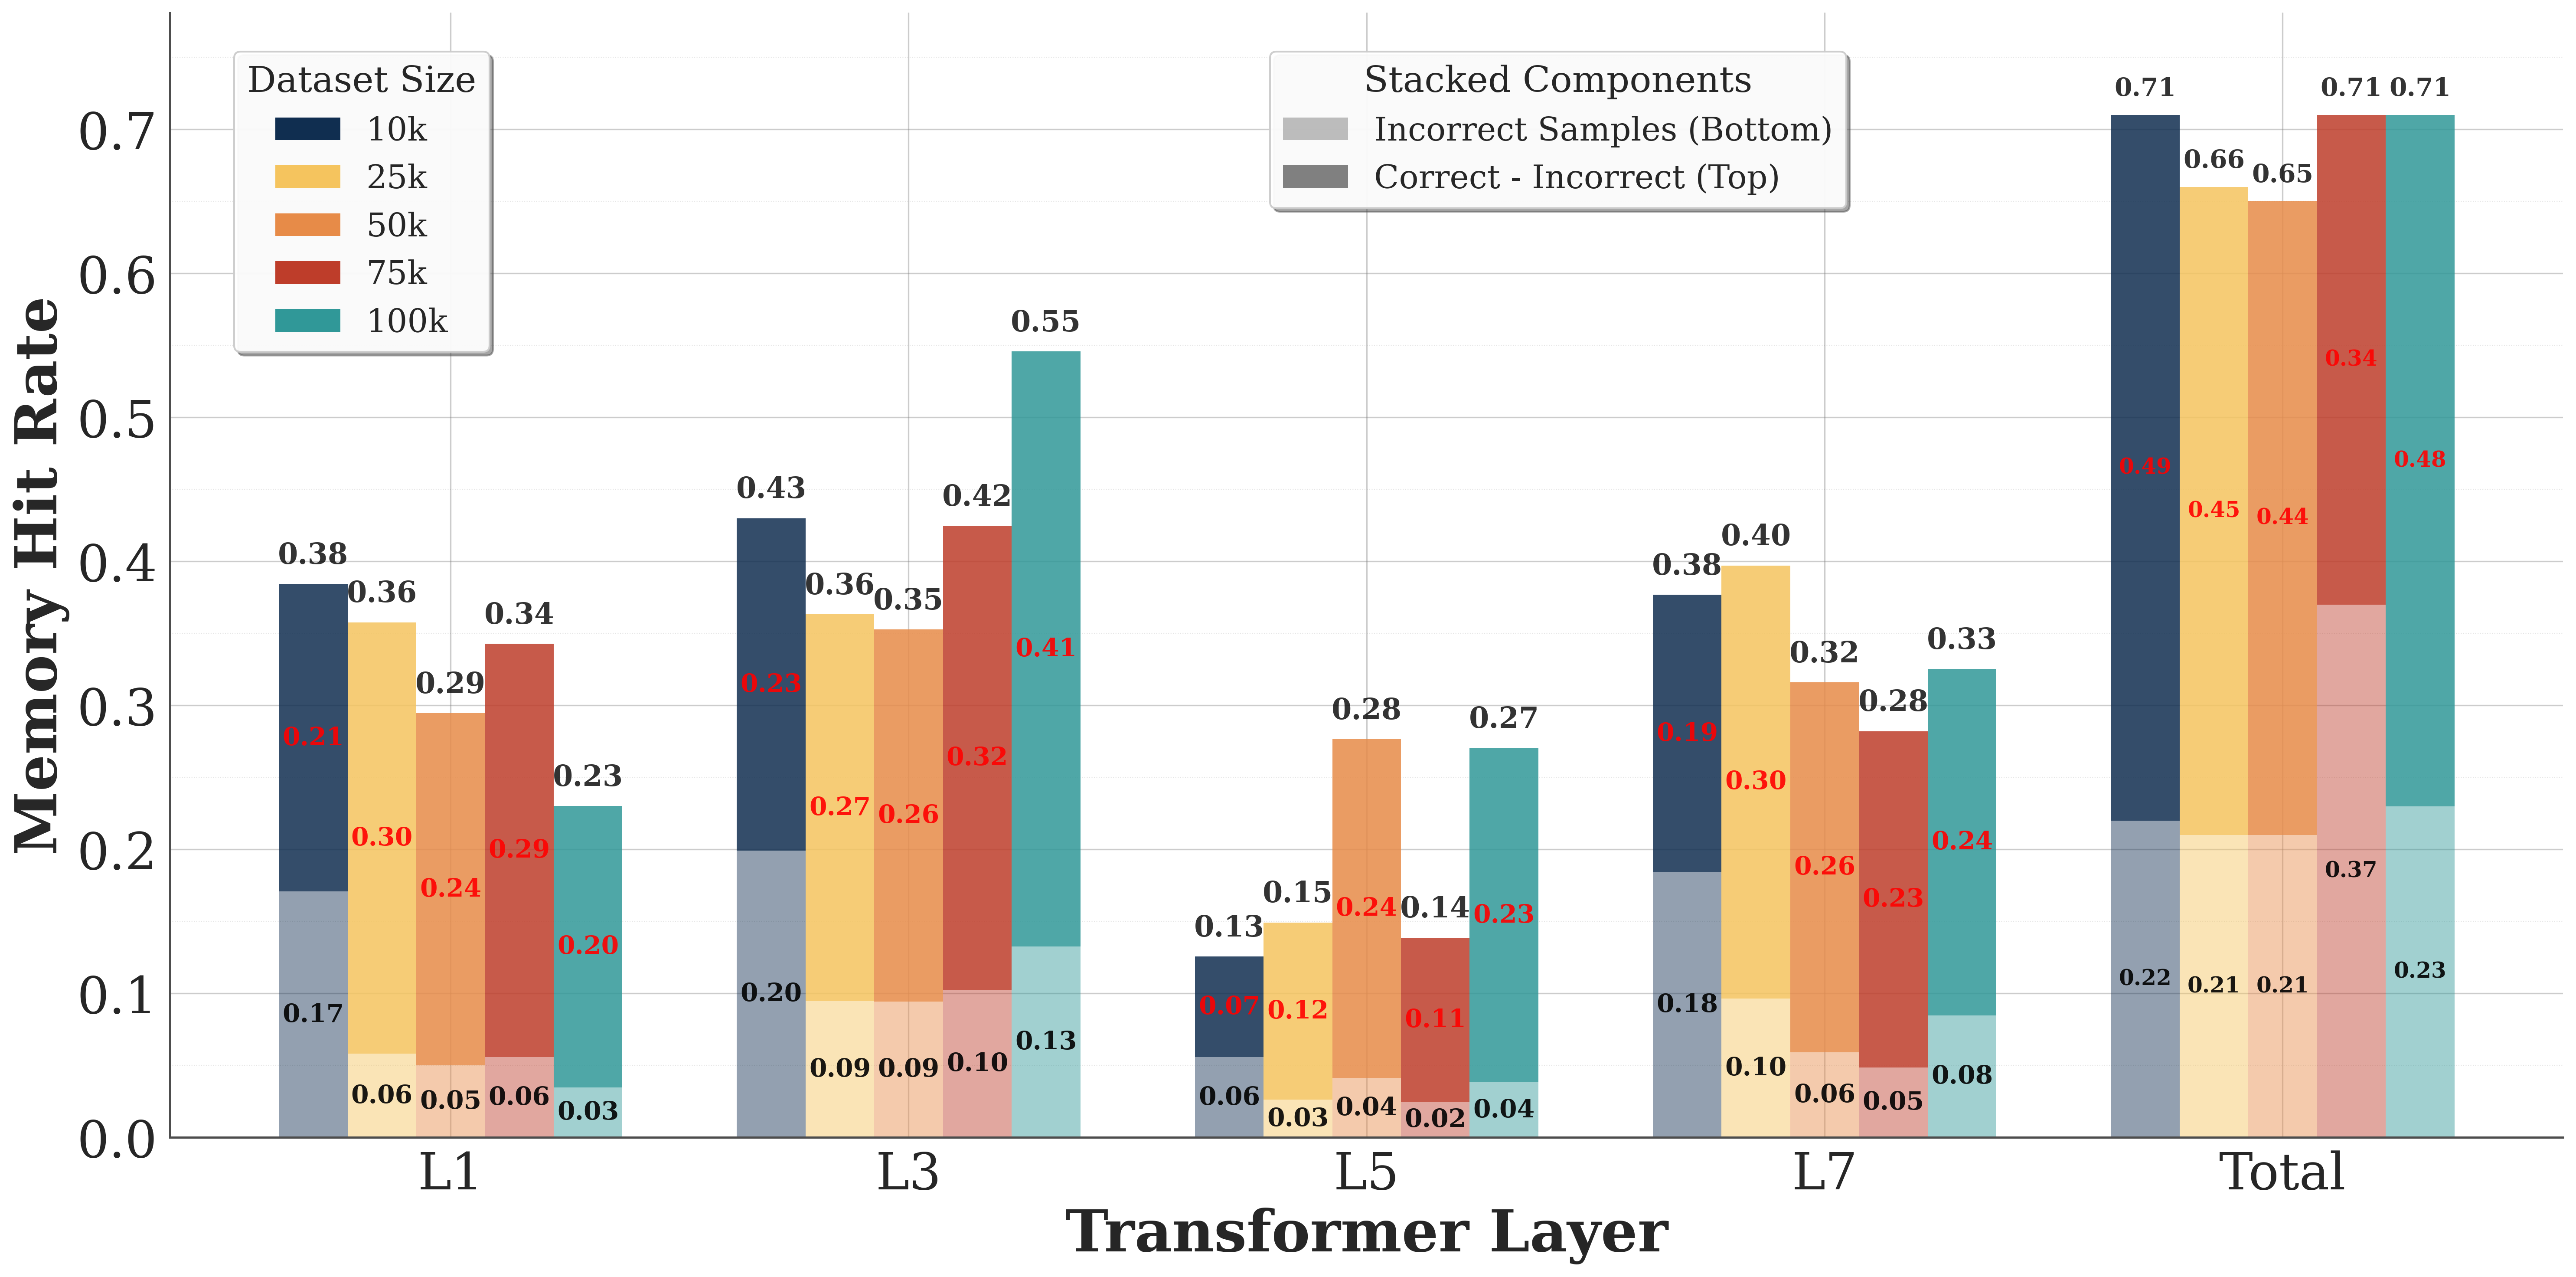
This is a stacked bar chart visualizing the Memory Hit Rate across different Transformer Layers (L1, L3, L5, L7, and Total) for varying Dataset Sizes (10k, 25k, 50k, 75k, and 100k). The bars are stacked to represent the contribution of "Correct - Incorrect" samples (top portion, grey/red) and "Incorrect Samples" (bottom portion, blue/green). The Y-axis represents the Memory Hit Rate, ranging from 0.0 to 0.7, while the X-axis represents the Transformer Layer.
### Components/Axes
* **X-axis:** Transformer Layer (L1, L3, L5, L7, Total)
* **Y-axis:** Memory Hit Rate (0.0 to 0.7)
* **Legend (Top-Left):** Dataset Size
* 10k (Dark Grey)
* 25k (Light Grey)
* 50k (Orange)
* 75k (Brown)
* 100k (Green)
* **Stacked Components Legend (Top-Center):**
* Incorrect Samples (Bottom - Blue/Green shades)
* Correct - Incorrect (Top - Grey/Red shades)
### Detailed Analysis
The chart presents a series of stacked bars, one for each Transformer Layer and each Dataset Size combination. The height of each bar represents the total Memory Hit Rate. The stacked segments show the proportion of the hit rate attributable to correct samples minus incorrect samples (top) and incorrect samples alone (bottom).
**L1 Layer:**
* 10k: Hit Rate ≈ 0.06 (Incorrect), 0.32 (Correct-Incorrect) - Total ≈ 0.38
* 25k: Hit Rate ≈ 0.06 (Incorrect), 0.29 (Correct-Incorrect) - Total ≈ 0.35
* 50k: Hit Rate ≈ 0.03 (Incorrect), 0.24 (Correct-Incorrect) - Total ≈ 0.27
* 75k: Hit Rate ≈ 0.05 (Incorrect), 0.20 (Correct-Incorrect) - Total ≈ 0.25
* 100k: Hit Rate ≈ 0.06 (Incorrect), 0.17 (Correct-Incorrect) - Total ≈ 0.23
**L3 Layer:**
* 10k: Hit Rate ≈ 0.09 (Incorrect), 0.34 (Correct-Incorrect) - Total ≈ 0.43
* 25k: Hit Rate ≈ 0.09 (Incorrect), 0.35 (Correct-Incorrect) - Total ≈ 0.44
* 50k: Hit Rate ≈ 0.09 (Incorrect), 0.27 (Correct-Incorrect) - Total ≈ 0.36
* 75k: Hit Rate ≈ 0.10 (Incorrect), 0.26 (Correct-Incorrect) - Total ≈ 0.36
* 100k: Hit Rate ≈ 0.13 (Incorrect), 0.20 (Correct-Incorrect) - Total ≈ 0.33
**L5 Layer:**
* 10k: Hit Rate ≈ 0.06 (Incorrect), 0.28 (Correct-Incorrect) - Total ≈ 0.34
* 25k: Hit Rate ≈ 0.04 (Incorrect), 0.27 (Correct-Incorrect) - Total ≈ 0.31
* 50k: Hit Rate ≈ 0.06 (Incorrect), 0.15 (Correct-Incorrect) - Total ≈ 0.21
* 75k: Hit Rate ≈ 0.04 (Incorrect), 0.14 (Correct-Incorrect) - Total ≈ 0.18
* 100k: Hit Rate ≈ 0.04 (Incorrect), 0.11 (Correct-Incorrect) - Total ≈ 0.15
**L7 Layer:**
* 10k: Hit Rate ≈ 0.10 (Incorrect), 0.38 (Correct-Incorrect) - Total ≈ 0.48
* 25k: Hit Rate ≈ 0.08 (Incorrect), 0.32 (Correct-Incorrect) - Total ≈ 0.40
* 50k: Hit Rate ≈ 0.06 (Incorrect), 0.26 (Correct-Incorrect) - Total ≈ 0.32
* 75k: Hit Rate ≈ 0.05 (Incorrect), 0.23 (Correct-Incorrect) - Total ≈ 0.28
* 100k: Hit Rate ≈ 0.06 (Incorrect), 0.21 (Correct-Incorrect) - Total ≈ 0.27
**Total:**
* 10k: Hit Rate ≈ 0.22 (Incorrect), 0.52 (Correct-Incorrect) - Total ≈ 0.74 (appears to be 0.71 on the chart)
* 25k: Hit Rate ≈ 0.21 (Incorrect), 0.45 (Correct-Incorrect) - Total ≈ 0.66 (appears to be 0.71 on the chart)
* 50k: Hit Rate ≈ 0.21 (Incorrect), 0.23 (Correct-Incorrect) - Total ≈ 0.44
* 75k: Hit Rate ≈ 0.21 (Incorrect), 0.17 (Correct-Incorrect) - Total ≈ 0.38
* 100k: Hit Rate ≈ 0.23 (Incorrect), 0.24 (Correct-Incorrect) - Total ≈ 0.47 (appears to be 0.48 on the chart)
### Key Observations
* The Memory Hit Rate generally increases with larger dataset sizes for the earlier Transformer Layers (L1, L3).
* The "Correct - Incorrect" component consistently contributes more to the overall Hit Rate than the "Incorrect Samples" component.
* The Total Hit Rate is highest for the 10k and 25k datasets, peaking around 0.71. The hit rate decreases for larger datasets.
* The L5 and L7 layers show relatively low hit rates across all dataset sizes.
* There appears to be a discrepancy between the Total Hit Rate values and the chart's labels (0.71 vs. 0.74, 0.71 vs. 0.66, 0.48 vs. 0.47).
### Interpretation
The data suggests that the model performs better (higher Memory Hit Rate) with smaller datasets, particularly in the earlier Transformer Layers. This could indicate that the model is overfitting to the smaller datasets or that the benefits of larger datasets are not fully realized in the later layers. The consistent positive contribution of the "Correct - Incorrect" component suggests that the model is generally able to distinguish between correct and incorrect samples, but the overall hit rate is limited by the number of incorrect samples. The decreasing hit rate for larger datasets in the "Total" category is a notable anomaly that warrants further investigation. It could be due to increased complexity in the data or limitations in the model's capacity to handle larger datasets effectively. The discrepancies in the Total Hit Rate labels suggest a potential error in the chart's presentation or data calculation.