## Bar Chart: Memory Hit Rate by Transformer Layer and Dataset Size
### Overview
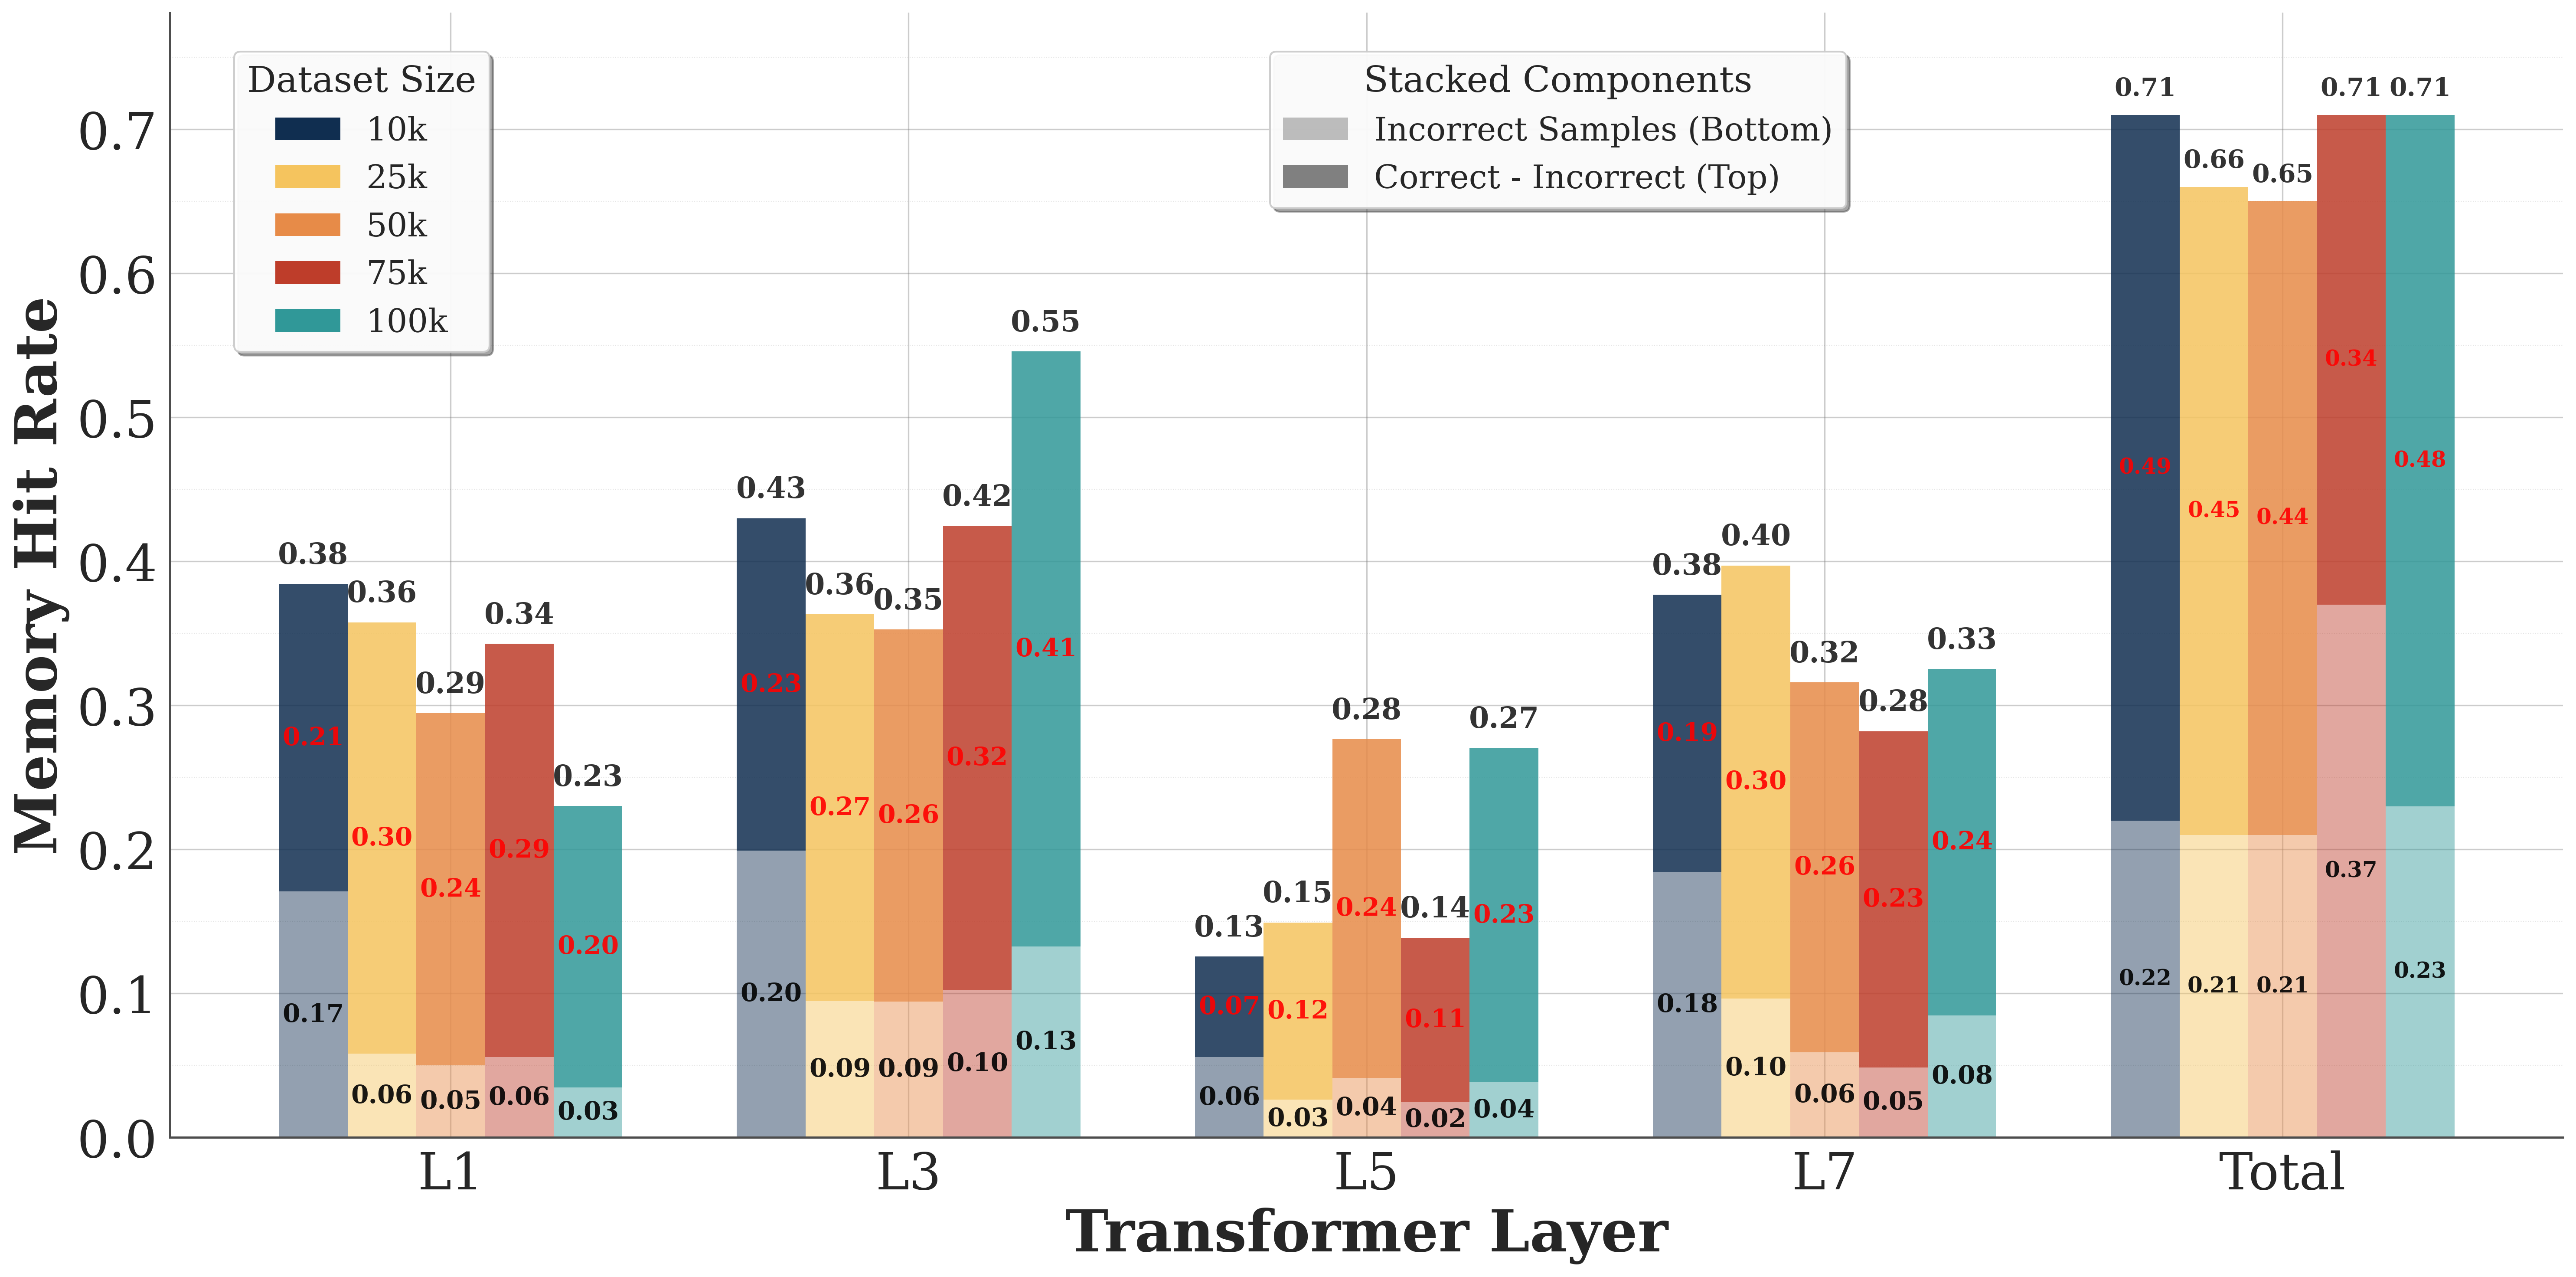
The chart visualizes memory hit rates across transformer layers (L1, L3, L5, L7, Total) for five dataset sizes (10k, 25k, 50k, 75k, 100k). Each bar is stacked to show two components: "Correct - Incorrect" (top) and "Incorrect Samples" (bottom). The y-axis ranges from 0 to 0.7, with values labeled on top of each bar segment.
### Components/Axes
- **X-axis (Transformer Layer)**: Labeled "Transformer Layer" with categories: L1, L3, L5, L7, Total.
- **Y-axis (Memory Hit Rate)**: Labeled "Memory Hit Rate" with a scale from 0 to 0.7.
- **Legend**: Located in the top-right corner. Colors represent:
- **Dataset Sizes**: Dark blue (10k), yellow (25k), orange (50k), red (75k), teal (100k).
- **Stacked Components**: Gray (Correct - Incorrect, top) and dark gray (Incorrect Samples, bottom).
### Detailed Analysis
#### Dataset Size Trends
- **10k (Dark Blue)**:
- L1: 0.38 (Correct - Incorrect), 0.21 (Incorrect Samples)
- L3: 0.43, 0.23
- L5: 0.13, 0.07
- L7: 0.38, 0.18
- Total: 0.71, 0.23
- **25k (Yellow)**:
- L1: 0.36, 0.30
- L3: 0.36, 0.27
- L5: 0.12, 0.09
- L7: 0.40, 0.30
- Total: 0.66, 0.21
- **50k (Orange)**:
- L1: 0.34, 0.29
- L3: 0.35, 0.26
- L5: 0.28, 0.24
- L7: 0.32, 0.26
- Total: 0.65, 0.21
- **75k (Red)**:
- L1: 0.34, 0.29
- L3: 0.42, 0.32
- L5: 0.14, 0.11
- L7: 0.23, 0.23
- Total: 0.71, 0.37
- **100k (Teal)**:
- L1: 0.23, 0.20
- L3: 0.55, 0.41
- L5: 0.27, 0.23
- L7: 0.33, 0.24
- Total: 0.71, 0.48
#### Stacked Component Trends
- **Correct - Incorrect (Gray)**:
- Increases with dataset size (e.g., 100k dataset rises from 0.23 in L1 to 0.71 in Total).
- Peaks in L3 and L7 for larger datasets.
- **Incorrect Samples (Dark Gray)**:
- Larger datasets show higher values (e.g., 100k dataset increases from 0.20 in L1 to 0.48 in Total).
- L3 and L7 layers exhibit notable spikes.
### Key Observations
1. **Total Layer Dominance**: The "Total" category consistently shows the highest memory hit rates across all dataset sizes, with 100k datasets reaching 0.71 for both components.
2. **Layer-Specific Peaks**:
- L3 and L7 layers show significant increases in memory hit rates for larger datasets (e.g., 100k dataset jumps from 0.23 in L1 to 0.55 in L3).
- L5 layers generally have lower values, suggesting reduced memory efficiency in mid-layers for smaller datasets.
3. **Incorrect Samples Contribution**: Larger datasets (75k, 100k) contribute disproportionately to the "Incorrect Samples" component, especially in L3 and L7 layers.
### Interpretation
The data suggests that:
- **Dataset Size Impacts Memory Efficiency**: Larger datasets (100k) consistently exhibit higher memory hit rates, indicating increased complexity or redundancy in memory access patterns.
- **Layer-Specific Behavior**: Early layers (L1, L3) show sharper increases in hit rates for larger datasets, while mid-layers (L5) plateau or decline, possibly due to architectural bottlenecks.
- **Error Propagation**: The "Incorrect Samples" component grows with dataset size, suggesting that larger datasets introduce more noise or edge cases that the model struggles to handle, particularly in deeper layers (L7).
This pattern aligns with transformer models' tendency to rely on early layers for basic feature extraction and later layers for complex reasoning, where larger datasets may exacerbate inefficiencies.