## Line Graphs: Throughput vs. Latency by Model and Batch Size
### Overview
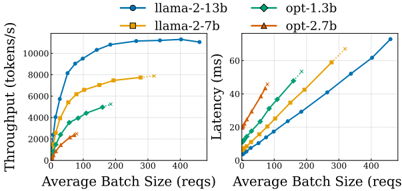
The image contains two line graphs comparing the performance of four language models (llama-2-13b, llama-2-7b, opt-1.3b, opt-2.7b) across varying average batch sizes. The left graph measures **throughput (tokens/s)**, while the right graph measures **latency (ms)**. Both graphs use the same x-axis (batch size) and y-axis scales, with distinct markers and colors for each model.
---
### Components/Axes
#### Left Graph (Throughput)
- **X-axis**: Average Batch Size (reqs) [0–400]
- **Y-axis**: Throughput (tokens/s) [0–12,000]
- **Legend**:
- **llama-2-13b**: Blue circles (●)
- **llama-2-7b**: Orange squares (■)
- **opt-1.3b**: Green diamonds (◆)
- **opt-2.7b**: Red triangles (▲)
#### Right Graph (Latency)
- **X-axis**: Average Batch Size (reqs) [0–400]
- **Y-axis**: Latency (ms) [0–60]
- **Legend**: Same as left graph (colors/markers match).
---
### Detailed Analysis
#### Left Graph (Throughput)
- **llama-2-13b (blue circles)**:
- Steeply increases from ~2,000 tokens/s at 0 reqs to ~10,000 tokens/s at 400 reqs.
- Plateaus near 10,000 tokens/s after 300 reqs.
- **llama-2-7b (orange squares)**:
- Rises from ~1,000 tokens/s to ~8,000 tokens/s, plateauing at ~7,500 tokens/s.
- **opt-1.3b (green diamonds)**:
- Gains from ~500 tokens/s to ~5,000 tokens/s, peaking at ~4,500 tokens/s.
- **opt-2.7b (red triangles)**:
- Lowest performance: ~300 tokens/s to ~2,000 tokens/s, peaking at ~1,800 tokens/s.
#### Right Graph (Latency)
- **llama-2-13b (blue circles)**:
- Linear increase from ~10 ms to ~60 ms.
- **llama-2-7b (orange squares)**:
- Slower rise: ~15 ms to ~50 ms.
- **opt-1.3b (green diamonds)**:
- Steeper slope: ~20 ms to ~55 ms.
- **opt-2.7b (red triangles)**:
- Highest latency: ~25 ms to ~60 ms.
---
### Key Observations
1. **Throughput Trends**:
- Larger batch sizes improve throughput for all models, but **llama-2-13b** dominates, achieving ~10,000 tokens/s at 400 reqs.
- **opt-2.7b** underperforms, with throughput capped at ~2,000 tokens/s.
2. **Latency Trends**:
- Latency increases linearly with batch size for all models.
- **opt-2.7b** exhibits the highest latency (~60 ms at 400 reqs), while **llama-2-13b** has the lowest (~60 ms).
3. **Trade-offs**:
- Higher throughput correlates with higher latency (e.g., llama-2-13b’s 10,000 tokens/s at 400 reqs vs. 60 ms latency).
- Smaller models (opt-1.3b, opt-2.7b) show diminishing returns in throughput but similar latency to larger models.
---
### Interpretation
- **Model Efficiency**:
- **llama-2-13b** balances high throughput and moderate latency, making it optimal for high-demand scenarios.
- **opt-2.7b** suffers from poor throughput and high latency, suggesting inefficiencies in scaling.
- **Batch Size Impact**:
- Throughput plateaus at larger batch sizes (e.g., llama-2-13b’s plateau at 300+ reqs), indicating diminishing returns.
- Latency grows predictably with batch size, highlighting a linear scaling challenge.
- **Model Choice**:
- For latency-sensitive applications, **llama-2-13b** is preferable despite its size.
- **opt-2.7b** may be unsuitable for high-throughput or low-latency use cases.
---
### Uncertainties
- Exact values are approximate due to visual estimation from the graph.
- The right graph’s y-axis (latency) appears to max out at ~60 ms, but data points near 400 reqs may extend slightly beyond this.