## Scatter Plot, Line Graph, and Network Diagram: Multi-Component Visualization
### Overview
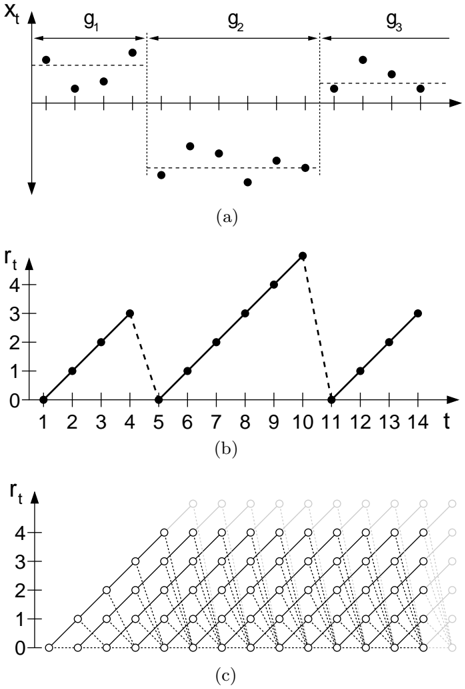
The image contains three distinct visualizations:
1. **(a)** A scatter plot with three labeled groups (g₁, g₂, g₃) on a 2D plane.
2. **(b)** A line graph with a zigzag pattern over time (t) and a dependent variable (rₜ).
3. **(c)** A network diagram with nodes connected in a grid-like structure, also labeled with t and rₜ axes.
### Components/Axes
#### (a) Scatter Plot
- **Axes**:
- **X-axis**: Labeled "X_t" (horizontal, left to right).
- **Y-axis**: Labeled "x_t" (vertical, bottom to top).
- **Groups**:
- **g₁**: Clustered in the upper-left region (X_t ≈ 1–3, x_t ≈ 1–2).
- **g₂**: Clustered in the middle (X_t ≈ 4–6, x_t ≈ 0.5–1.5).
- **g₃**: Clustered in the upper-right region (X_t ≈ 7–9, x_t ≈ 1.5–2.5).
- **Data Points**: Black dots with no explicit numerical labels.
#### (b) Line Graph
- **Axes**:
- **X-axis**: Labeled "t" (time, 1–14).
- **Y-axis**: Labeled "rₜ" (dependent variable, 0–4).
- **Data Points**:
- **t=1**: rₜ = 0
- **t=2**: rₜ = 1
- **t=3**: rₜ = 2
- **t=4**: rₜ = 3
- **t=5**: rₜ = 0 (sharp drop)
- **t=6**: rₜ = 1
- **t=7**: rₜ = 2
- **t=8**: rₜ = 3
- **t=9**: rₜ = 4 (peak)
- **t=10**: rₜ = 0 (sharp drop)
- **t=11**: rₜ = 0
- **t=12**: rₜ = 1
- **t=13**: rₜ = 2
- **t=14**: rₜ = 3
- **Trend**: Zigzag pattern with peaks at t=4, t=9, and t=14.
#### (c) Network Diagram
- **Axes**:
- **X-axis**: Labeled "t" (time, 1–14).
- **Y-axis**: Labeled "rₜ" (dependent variable, 0–4).
- **Structure**:
- Nodes arranged in a grid, with lines connecting them diagonally.
- Nodes are labeled with "t" values (1–14) and "rₜ" values (0–4).
- Lines form a pattern of increasing density over time.
### Detailed Analysis
#### (a) Scatter Plot
- **Groups**:
- **g₁**: 3 points (X_t ≈ 1–3, x_t ≈ 1–2).
- **g₂**: 4 points (X_t ≈ 4–6, x_t ≈ 0.5–1.5).
- **g₃**: 4 points (X_t ≈ 7–9, x_t ≈ 1.5–2.5).
- **Trend**: Clear separation between groups, suggesting distinct categories or clusters.
#### (b) Line Graph
- **Trend**:
- **Rising phase**: t=1–4 (rₜ increases from 0 to 3).
- **Drop**: t=5 (rₜ = 0).
- **Recovery**: t=6–9 (rₜ increases to 4).
- **Drop**: t=10 (rₜ = 0).
- **Recovery**: t=11–14 (rₜ increases to 3).
- **Notable**: Sharp drops at t=5 and t=10, followed by recovery.
#### (c) Network Diagram
- **Structure**:
- Nodes are connected in a grid, with lines forming a diagonal pattern.
- Nodes at the bottom-left (t=1, rₜ=0) connect to nodes at the top-right (t=14, rₜ=4).
- Lines become denser as t increases, suggesting a progression or dependency over time.
### Key Observations
1. **(a)**: The scatter plot shows three distinct clusters (g₁, g₂, g₃), indicating potential categorical or hierarchical relationships.
2. **(b)**: The line graph exhibits periodic fluctuations with sharp drops and recoveries, possibly reflecting cyclical or event-driven behavior.
3. **(c)**: The network diagram suggests a time-dependent progression, with nodes and connections evolving over t.
### Interpretation
- **(a)**: The groups (g₁, g₂, g₃) may represent different categories or states in a system, with spatial separation indicating distinct characteristics.
- **(b)**: The zigzag pattern in (b) could model a system with periodic disruptions (e.g., economic cycles, biological rhythms) or external interventions.
- **(c)**: The network diagram might illustrate a process where nodes (e.g., agents, data points) interact over time, with connections strengthening as t increases.
- **Cross-Visualization**: The shared axes (t and rₜ) in (b) and (c) suggest a temporal relationship, while (a) provides a categorical perspective. The sharp drops in (b) might correspond to events that reset or alter the system, reflected in the network's evolving structure in (c).
### Notes on Uncertainty
- Exact numerical values for (a) are not provided, but approximate positions are inferred from the plot.
- The network diagram (c) lacks explicit numerical labels for nodes, so connections are described qualitatively.
- The line graph (b) includes precise values for rₜ at integer t, but the underlying mechanism for the zigzag pattern is not specified.