TECHNICAL ASSET FINGERPRINT
53be785a98fbe6382ced7b51
Click to view fullscreen
Press ESC or click to close
FOUND IN PAPERS
EXPERT: healer-alpha-free VERSION 1
RUNTIME: free/openrouter/healer-alpha
INTEL_VERIFIED
\n
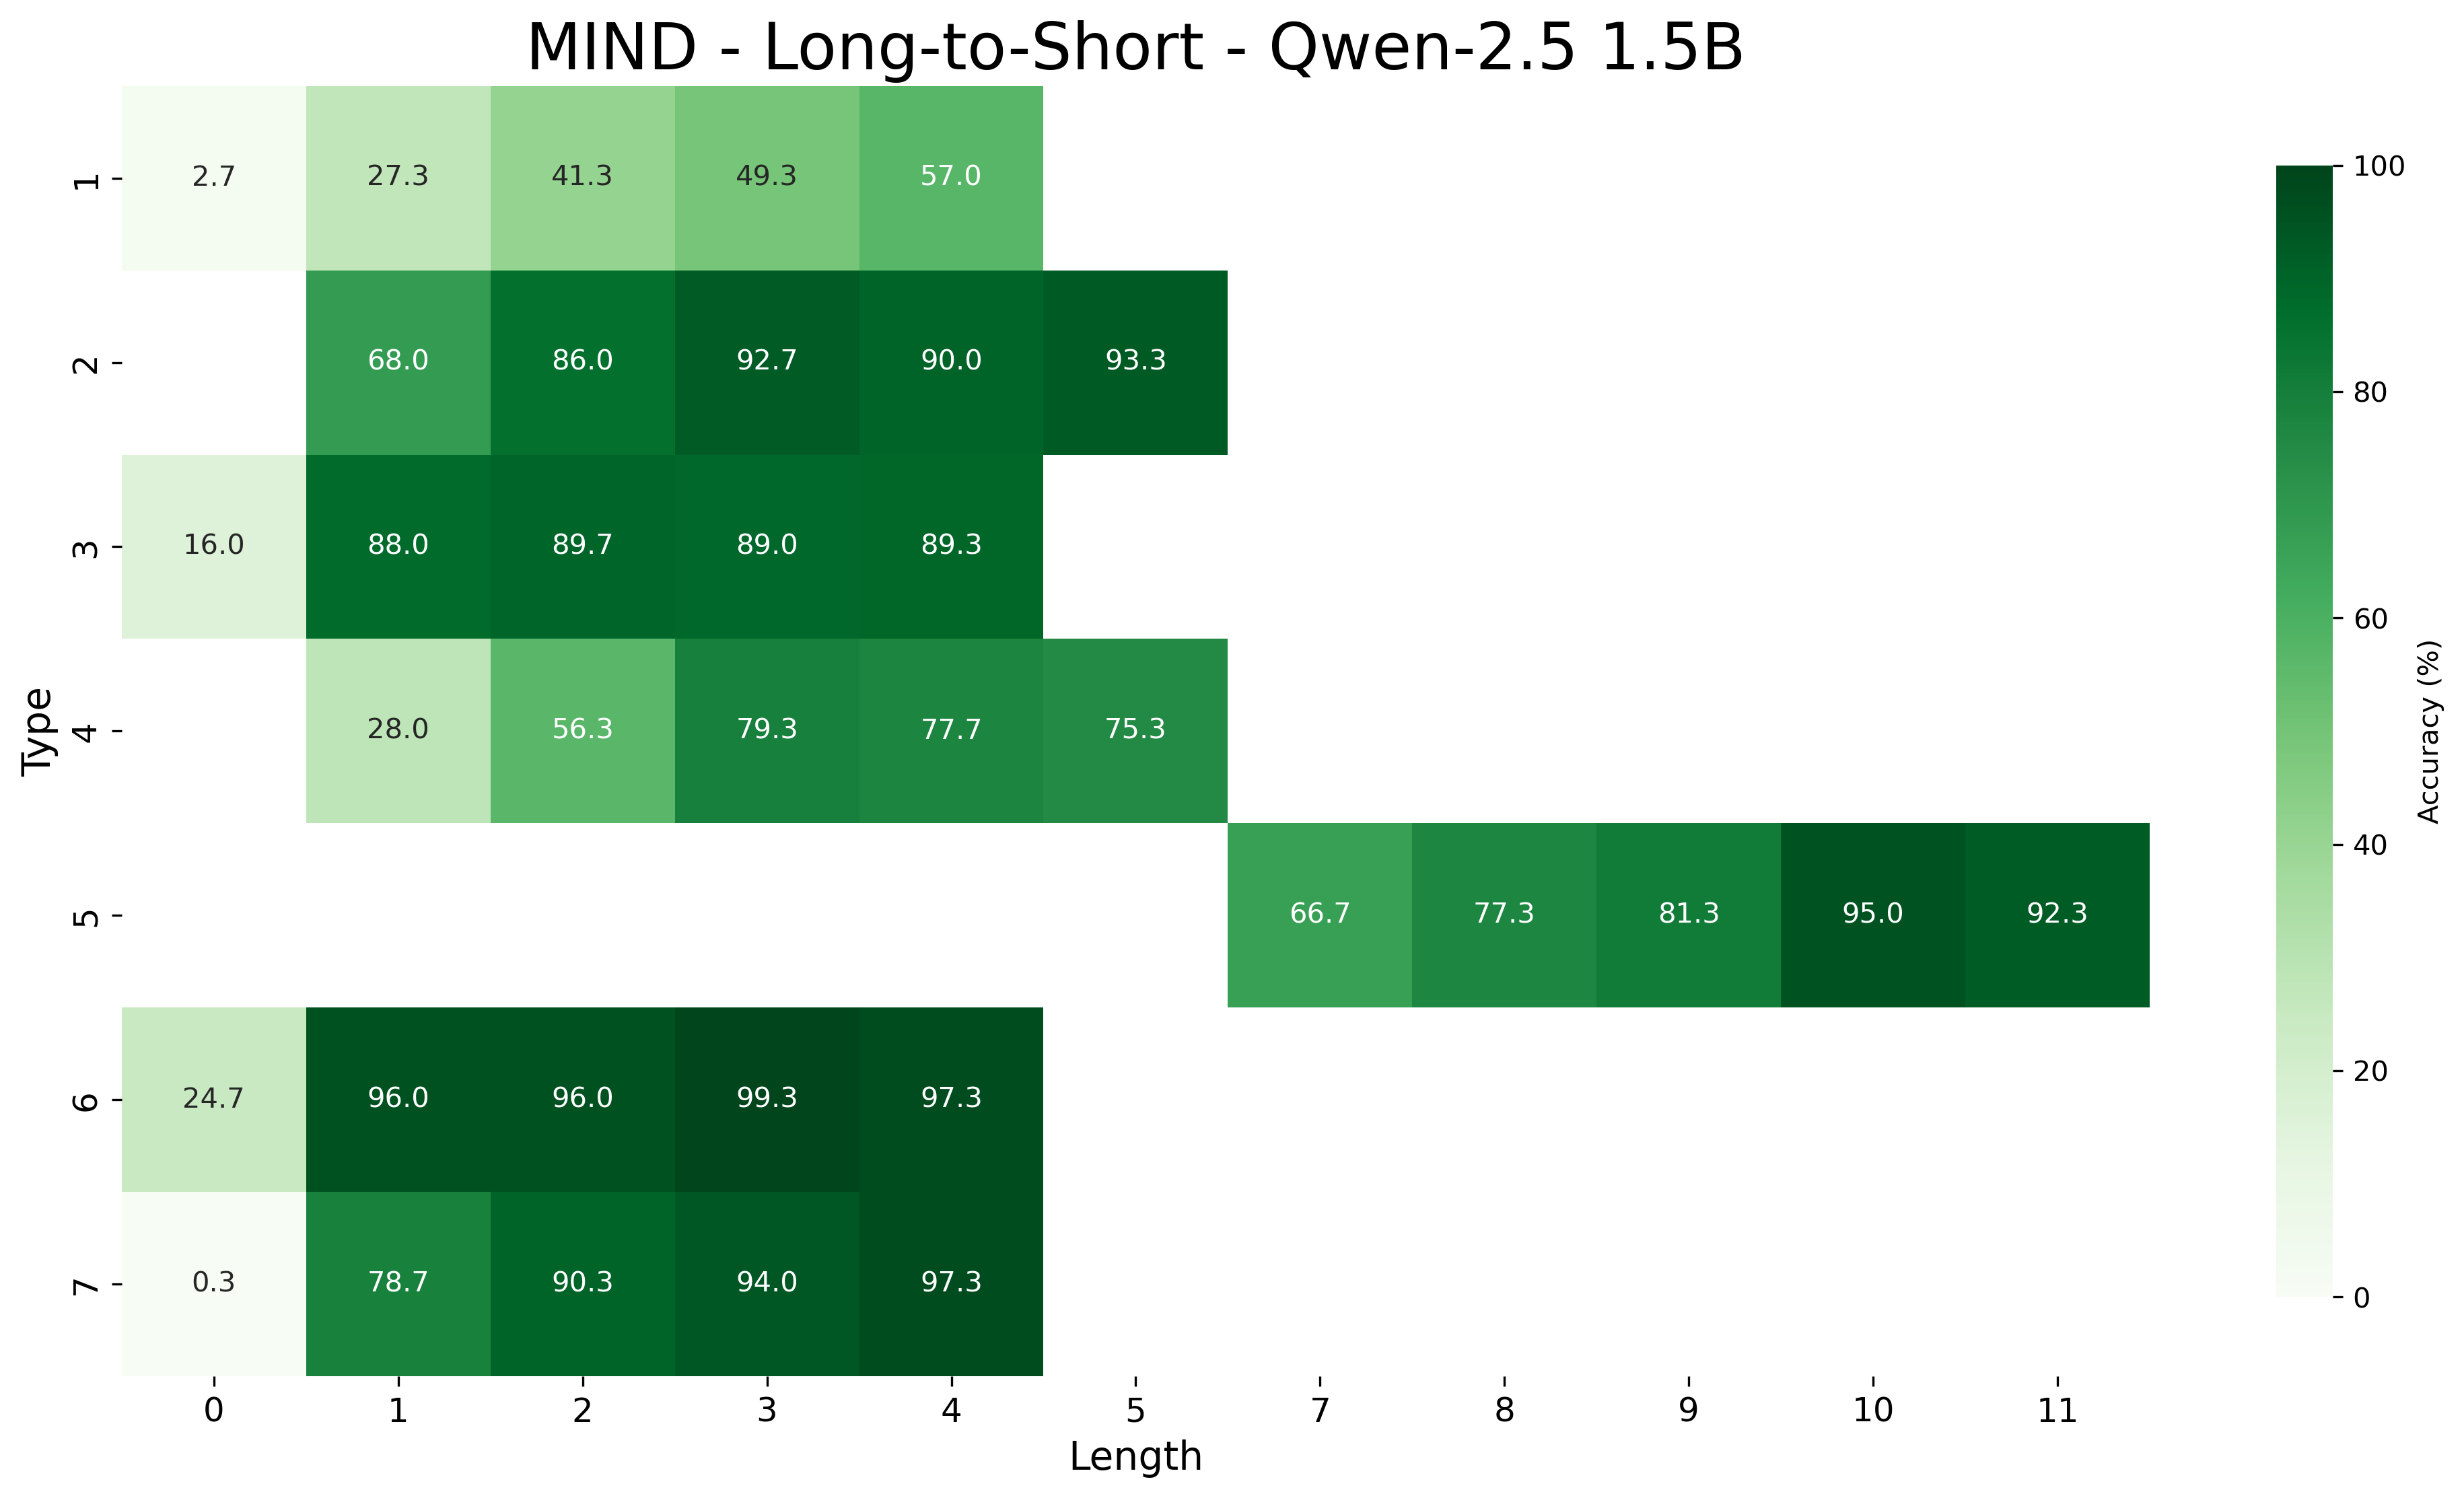
## Heatmap: MIND - Long-to-Short - Qwen-2.5 1.5B
### Overview
This image is a heatmap visualizing the accuracy (in percentage) of a model named "Qwen-2.5 1.5B" on a task or dataset referred to as "MIND - Long-to-Short". The chart plots performance across two dimensions: "Type" (y-axis) and "Length" (x-axis). The color intensity of each cell represents the accuracy value, with a corresponding color bar legend on the right side of the chart.
### Components/Axes
* **Title:** "MIND - Long-to-Short - Qwen-2.5 1.5B" (centered at the top).
* **Y-Axis (Vertical):** Labeled "Type". It lists seven discrete categories, numbered 1 through 7 from top to bottom.
* **X-Axis (Horizontal):** Labeled "Length". It lists discrete numerical values: 0, 1, 2, 3, 4, 5, 7, 8, 9, 10, 11. Note that the value '6' is absent from the axis.
* **Color Bar Legend:** Positioned vertically on the right side of the chart. It is labeled "Accuracy (%)" and provides a scale from 0 (lightest green/white) to 100 (darkest green). The scale has major tick marks at 0, 20, 40, 60, 80, and 100.
* **Data Cells:** The main body of the chart consists of a grid of colored rectangles. Each cell corresponds to a specific (Type, Length) pair and contains a numerical value representing the accuracy percentage. Not all grid positions are filled; some cells are empty (white), indicating no data for that combination.
### Detailed Analysis
The following table reconstructs the data presented in the heatmap. Empty cells are denoted by "N/A".
| Type \ Length | 0 | 1 | 2 | 3 | 4 | 5 | 7 | 8 | 9 | 10 | 11 |
| :------------ | :---- | :---- | :---- | :---- | :---- | :---- | :---- | :---- | :---- | :---- | :---- |
| **1** | 2.7 | 27.3 | 41.3 | 49.3 | 57.0 | N/A | N/A | N/A | N/A | N/A | N/A |
| **2** | N/A | 68.0 | 86.0 | 92.7 | 90.0 | 93.3 | N/A | N/A | N/A | N/A | N/A |
| **3** | 16.0 | 88.0 | 89.7 | 89.0 | 89.3 | N/A | N/A | N/A | N/A | N/A | N/A |
| **4** | N/A | 28.0 | 56.3 | 79.3 | 77.7 | 75.3 | N/A | N/A | N/A | N/A | N/A |
| **5** | N/A | N/A | N/A | N/A | N/A | N/A | 66.7 | 77.3 | 81.3 | 95.0 | 92.3 |
| **6** | 24.7 | 96.0 | 96.0 | 99.3 | 97.3 | N/A | N/A | N/A | N/A | N/A | N/A |
| **7** | 0.3 | 78.7 | 90.3 | 94.0 | 97.3 | N/A | N/A | N/A | N/A | N/A | N/A |
**Trend Verification by Type:**
* **Type 1:** Shows a steady, positive trend. Accuracy increases monotonically from 2.7% at Length 0 to 57.0% at Length 4.
* **Type 2:** Shows a strong positive trend, peaking at Length 5 (93.3%). There is a slight dip at Length 4 (90.0%) compared to Length 3 (92.7%).
* **Type 3:** Shows a sharp initial increase from Length 0 (16.0%) to Length 1 (88.0%), then plateaus in the high 80s for Lengths 1-4.
* **Type 4:** Shows a positive trend from Length 1 to Length 3, then a slight decline for Lengths 4 and 5.
* **Type 5:** Data only exists for longer lengths (7-11). It shows a generally positive trend, peaking at Length 10 (95.0%).
* **Type 6:** Shows very high accuracy across all available lengths. It starts at 24.7% for Length 0 and jumps to 96.0% for Length 1, maintaining near-perfect scores thereafter.
* **Type 7:** Shows a dramatic positive trend. Accuracy starts near zero (0.3%) at Length 0 and increases sharply to 97.3% by Length 4.
### Key Observations
1. **Performance Variability:** There is significant variability in model performance across different "Types". Type 6 consistently achieves the highest accuracy (96-99% for Lengths 1-4), while Type 1 shows the lowest overall performance, never exceeding 57%.
2. **Length Sensitivity:** For most Types (1, 2, 3, 4, 6, 7), accuracy improves substantially as the "Length" increases from 0 or 1. This suggests the model's performance on the "Long-to-Short" task is highly dependent on sequence length.
3. **Data Sparsity:** The heatmap is not a complete grid. Data for Types 1-4 and 6-7 is only provided for shorter lengths (0-5). Data for Type 5 is only provided for longer lengths (7-11). This creates two distinct clusters in the visualization.
4. **Outliers:**
* **Type 7 at Length 0:** The accuracy of 0.3% is the lowest value in the entire dataset, indicating a near-total failure for this specific condition.
* **Type 6 at Length 0:** While 24.7% is low, it is notably higher than the starting points of Type 1 (2.7%) and Type 7 (0.3%), suggesting Type 6 is somewhat more robust even at the shortest length.
5. **Plateaus:** Type 3's performance plateaus quickly after Length 1, suggesting that beyond a minimal length, additional length provides no benefit for this Type. Type 6 also plateaus at a very high level.
### Interpretation
This heatmap provides a diagnostic view of the Qwen-2.5 1.5B model's capabilities on the MIND "Long-to-Short" task. The data suggests the following:
* **Task Difficulty is Type-Dependent:** The "Type" category is a primary determinant of task difficulty. The model finds some Types (e.g., 6, 3) inherently easier to solve than others (e.g., 1, 7 at short lengths). This could reflect differences in the complexity, structure, or required reasoning for each Type.
* **Critical Role of Context Length:** The strong positive correlation between "Length" and accuracy for most Types indicates that the model relies heavily on context. The "Long-to-Short" task likely involves summarizing, compressing, or extracting information from longer sequences. The model's ability to perform this function degrades severely when the input sequence is too short (Length 0 or 1), as it lacks sufficient context to generate an accurate short output.
* **Model Specialization or Bias:** The stark performance difference between Type 6 (consistently high) and Type 1 (consistently lower) may indicate the model was trained on data that better aligns with the characteristics of Type 6, or that the architecture of this 1.5B parameter model is better suited to the pattern recognition required for certain Types.
* **Practical Implication:** For practical application, this model would require a minimum input length (likely ≥1 or ≥2) to achieve acceptable performance on most task Types. Its performance is unreliable for extremely short inputs, especially for certain task categories. The separate data cluster for Type 5 suggests it may be a fundamentally different sub-task requiring longer inputs by design.
DECODING INTELLIGENCE...