## Scatter Plot: High School Statistics
### Overview
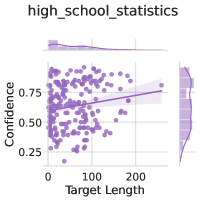
The image is a scatter plot titled "high_school_statistics". It displays the relationship between "Target Length" on the x-axis and "Confidence" on the y-axis. The scatter plot includes a regression line with a confidence interval shaded around it. Histograms are displayed along the top and right edges, showing the distributions of Target Length and Confidence, respectively.
### Components/Axes
* **Title:** high\_school\_statistics
* **X-axis:** Target Length
* Scale: 0 to 200, with tick marks at approximately 0, 100, and 200.
* **Y-axis:** Confidence
* Scale: 0.25 to 0.75, with tick marks at approximately 0.25, 0.50, and 0.75.
* **Data Points:** Purple scatter points.
* **Regression Line:** A purple line showing the linear regression fit to the data.
* **Confidence Interval:** A shaded purple region around the regression line, indicating the confidence interval.
* **Marginal Histograms:**
* Top: Histogram of Target Length.
* Right: Histogram of Confidence.
### Detailed Analysis
* **Target Length:** The data points are distributed from approximately 0 to 200. The histogram shows a concentration of data points between 0 and 100.
* **Confidence:** The data points are distributed from approximately 0.25 to 0.75. The histogram shows a concentration of data points around 0.50 to 0.75.
* **Regression Line:** The regression line has a slight positive slope, indicating a weak positive correlation between Target Length and Confidence.
* **Data Points:** The scatter plot shows a wide spread of data points, suggesting a moderate amount of variability in the relationship between Target Length and Confidence.
### Key Observations
* There is a slight positive correlation between Target Length and Confidence.
* The confidence interval around the regression line is relatively wide, indicating uncertainty in the relationship.
* The data points are clustered in the lower left region of the plot, suggesting that shorter target lengths tend to be associated with lower confidence.
### Interpretation
The scatter plot suggests a weak positive relationship between Target Length and Confidence. As Target Length increases, Confidence tends to increase slightly, but there is a lot of variability in the data. The wide confidence interval indicates that the relationship is not very strong or precise. The clustering of data points in the lower left region suggests that shorter target lengths are often associated with lower confidence. This could imply that individuals are less confident when dealing with shorter targets, or that the nature of shorter targets inherently leads to lower confidence levels.