## Scatter Plot: high_school_statistics
### Overview
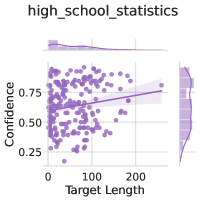
The image is a scatter plot titled "high_school_statistics" showing the relationship between "Target Length" (x-axis) and "Confidence" (y-axis). A linear regression line with a shaded confidence interval is overlaid on the data points. The plot includes marginal histograms for both axes.
### Components/Axes
- **X-axis (Target Length)**: Labeled "Target Length," ranging from 0 to 200 in increments of 50.
- **Y-axis (Confidence)**: Labeled "Confidence," ranging from 0.25 to 0.75 in increments of 0.10.
- **Data Points**: Purple dots representing individual observations.
- **Regression Line**: A solid purple line with a shaded confidence interval (approximately ±0.05 around the line).
- **Marginal Histograms**:
- Top histogram: Distribution of "Target Length" (peaks near 100).
- Right histogram: Distribution of "Confidence" (peaks near 0.5).
### Detailed Analysis
- **Regression Line**:
- Starts near (0, 0.5) and ends near (200, 0.75).
- Slope: Approximately 0.00125 per unit increase in "Target Length" (calculated as (0.75 - 0.5)/(200 - 0)).
- Confidence interval: Shaded area spans ~0.5 to 0.75 at x=200 and ~0.45 to 0.55 at x=0.
- **Data Points**:
- Scattered across the plot but clustered around the regression line.
- Confidence values range from ~0.3 to ~0.7, with higher concentrations near the line.
- **Histograms**:
- "Target Length" peaks at ~100 (mode).
- "Confidence" peaks at ~0.5 (mode).
### Key Observations
1. **Positive Correlation**: Confidence increases with Target Length, though the relationship is weak (slope ~0.00125).
2. **Data Spread**: Most data points fall within the shaded confidence interval, suggesting moderate predictive accuracy.
3. **Distribution Patterns**:
- Common Target Lengths cluster around 100.
- Confidence values are most frequent near 0.5.
4. **No Outliers**: No data points deviate significantly from the regression line.
### Interpretation
The plot suggests a weak positive relationship between Target Length and Confidence in high school statistics. Longer Target Lengths are associated with higher Confidence, but the effect is small (e.g., a 200-unit increase in Target Length corresponds to only a 0.25 increase in Confidence). The shaded confidence interval indicates uncertainty in the regression estimate, and the marginal histograms reveal that most observations cluster around moderate values for both variables. This could imply that Target Length alone explains limited variance in Confidence, and other factors may play a significant role. The absence of outliers suggests consistent data collection or a controlled experimental design.