## Line Charts: Reward vs. Timesteps for Deepq and PPO2 Baselines
### Overview
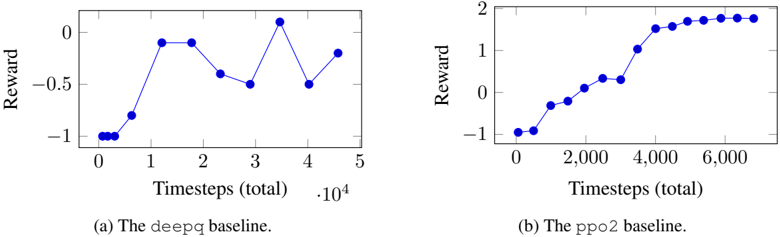
The image contains two line charts comparing the reward obtained by two different reinforcement learning algorithms, Deepq and PPO2, over a number of timesteps. The x-axis represents the total timesteps (in units of 10,000), and the y-axis represents the reward.
### Components/Axes
**Chart (a): Deepq Baseline**
* **Title:** (a) The deepq baseline.
* **X-axis:** Timesteps (total) * 10^4
* **X-axis Markers:** 0, 1, 2, 3, 4, 5
* **Y-axis:** Reward
* **Y-axis Markers:** -1, -0.5, 0
* **Data Series:** Blue line representing the reward obtained by the Deepq algorithm.
**Chart (b): PPO2 Baseline**
* **Title:** (b) The ppo2 baseline.
* **X-axis:** Timesteps (total)
* **X-axis Markers:** 0, 2,000, 4,000, 6,000
* **Y-axis:** Reward
* **Y-axis Markers:** -1, 0, 1, 2
* **Data Series:** Blue line representing the reward obtained by the PPO2 algorithm.
### Detailed Analysis
**Chart (a): Deepq Baseline**
* **Trend:** The reward initially stays at approximately -1 for the first 0.5 * 10^4 timesteps. It then increases sharply to approximately -0.05 at 1 * 10^4 timesteps, remains relatively constant until 2 * 10^4 timesteps, then decreases to approximately -0.4 at 2.5 * 10^4 timesteps, then decreases further to approximately -0.5 at 3 * 10^4 timesteps, then increases sharply to approximately 0.1 at 3.5 * 10^4 timesteps, then decreases to approximately -0.5 at 4 * 10^4 timesteps, then increases to approximately -0.2 at 4.5 * 10^4 timesteps.
* **Data Points:**
* (0, -1)
* (0.5, -1)
* (1, -0.05)
* (1.5, -0.05)
* (2, -0.05)
* (2.5, -0.4)
* (3, -0.5)
* (3.5, 0.1)
* (4, -0.5)
* (4.5, -0.2)
**Chart (b): PPO2 Baseline**
* **Trend:** The reward starts at approximately -1 and gradually increases with timesteps. It shows a steep increase between 2,000 and 4,000 timesteps, then plateaus around a reward value of 1.8.
* **Data Points:**
* (0, -1)
* (500, -0.4)
* (1000, -0.2)
* (1500, -0.1)
* (2000, -0.05)
* (2500, 0.2)
* (3000, 0.4)
* (3500, 1)
* (4000, 1.5)
* (4500, 1.7)
* (5000, 1.8)
* (5500, 1.8)
* (6000, 1.9)
* (6500, 1.9)
### Key Observations
* The PPO2 baseline consistently achieves higher rewards than the Deepq baseline after a certain number of timesteps.
* The Deepq baseline shows more fluctuation in reward during training.
* The PPO2 baseline demonstrates a more stable and consistent learning curve.
### Interpretation
The charts illustrate the performance of two different reinforcement learning algorithms on a specific task. The PPO2 algorithm appears to be more effective in this scenario, as it achieves higher rewards and exhibits a more stable learning process compared to the Deepq algorithm. The Deepq algorithm's fluctuating reward suggests that it may be more sensitive to the environment or require more fine-tuning to achieve optimal performance. The PPO2 algorithm converges to a higher reward value, indicating that it is better at learning the optimal policy for this task.