## Line Graphs: Reward vs. Timesteps for DeepQ and PPO2 Baselines
### Overview
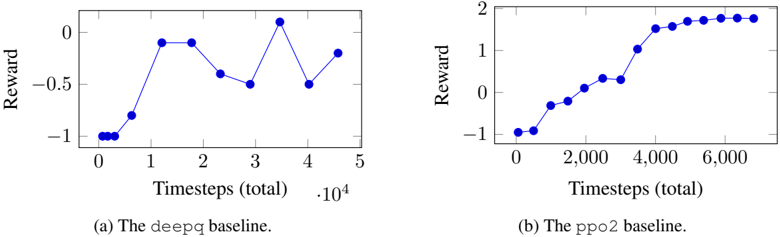
The image contains two line graphs comparing the performance of two reinforcement learning baselines (`deepq` and `ppo2`) over time. Each graph plots "Reward" against "Timesteps (total)", with distinct trends observed for each baseline.
---
### Components/Axes
1. **Graph (a): The `deepq` baseline**
- **X-axis**: "Timesteps (total)" with values from 0 to 5 (scaled by 10⁴, i.e., 0 to 50,000 timesteps).
- **Y-axis**: "Reward" ranging from -1 to 0.
- **Legend**: Labeled "(a) The `deepq` baseline" at the bottom.
- **Line**: Blue, with discrete data points connected by straight lines.
2. **Graph (b): The `ppo2` baseline**
- **X-axis**: "Timesteps (total)" with values from 0 to 6,000.
- **Y-axis**: "Reward" ranging from -1 to 2.
- **Legend**: Labeled "(b) The `ppo2` baseline" at the bottom.
- **Line**: Blue, with discrete data points connected by straight lines.
---
### Detailed Analysis
#### Graph (a): `deepq` Baseline
- **Key Data Points**:
- Timestep 0: Reward ≈ -1.
- Timestep 1: Reward ≈ 0.
- Timestep 2: Reward ≈ 0.
- Timestep 3: Reward ≈ -0.5.
- Timestep 4: Reward ≈ 0.
- Timestep 5: Reward ≈ -0.5.
- **Trend**: The reward fluctuates significantly, with sharp increases and decreases. The baseline starts at -1, peaks at 0 (timesteps 1–2), drops to -0.5 (timestep 3), recovers to 0 (timestep 4), and ends at -0.5 (timestep 5).
#### Graph (b): `ppo2` Baseline
- **Key Data Points**:
- Timestep 0: Reward ≈ -1.
- Timestep 2,000: Reward ≈ -0.5.
- Timestep 4,000: Reward ≈ 1.
- Timestep 6,000: Reward ≈ 2.
- **Trend**: The reward increases steadily from -1 to 2, with a plateau near 2 after timestep 4,000. The improvement is smooth and consistent compared to `deepq`.
---
### Key Observations
1. **Volatility vs. Stability**:
- `deepq` exhibits erratic performance, with rewards oscillating between -1 and 0.
- `ppo2` shows a stable, upward trajectory, achieving a reward of 2 by the end of training.
2. **Scaling Differences**:
- `deepq` is evaluated over 50,000 timesteps (0–5 × 10⁴), while `ppo2` is evaluated over 6,000 timesteps. This suggests differing training durations or problem complexities.
3. **Performance Gap**:
- `ppo2` outperforms `deepq` by a margin of 2.5 (reward of 2 vs. -0.5 at their final timesteps).
---
### Interpretation
- **Algorithmic Efficiency**: The `ppo2` baseline demonstrates superior learning stability and optimization, likely due to its policy optimization framework, which reduces variance in rewards.
- **DeepQ Limitations**: The `deepq` baseline’s fluctuations may stem from Q-learning’s sensitivity to exploration-exploitation trade-offs or reward sparsity.
- **Practical Implications**: `ppo2` is preferable for tasks requiring consistent performance, while `deepq` might be suitable for simpler or less dynamic environments.
No additional languages or non-textual elements are present. All data points and labels are explicitly extracted from the graphs.