## Heatmap: Performance Metric vs. Number of Feedback Repairs and Initial Programs
### Overview
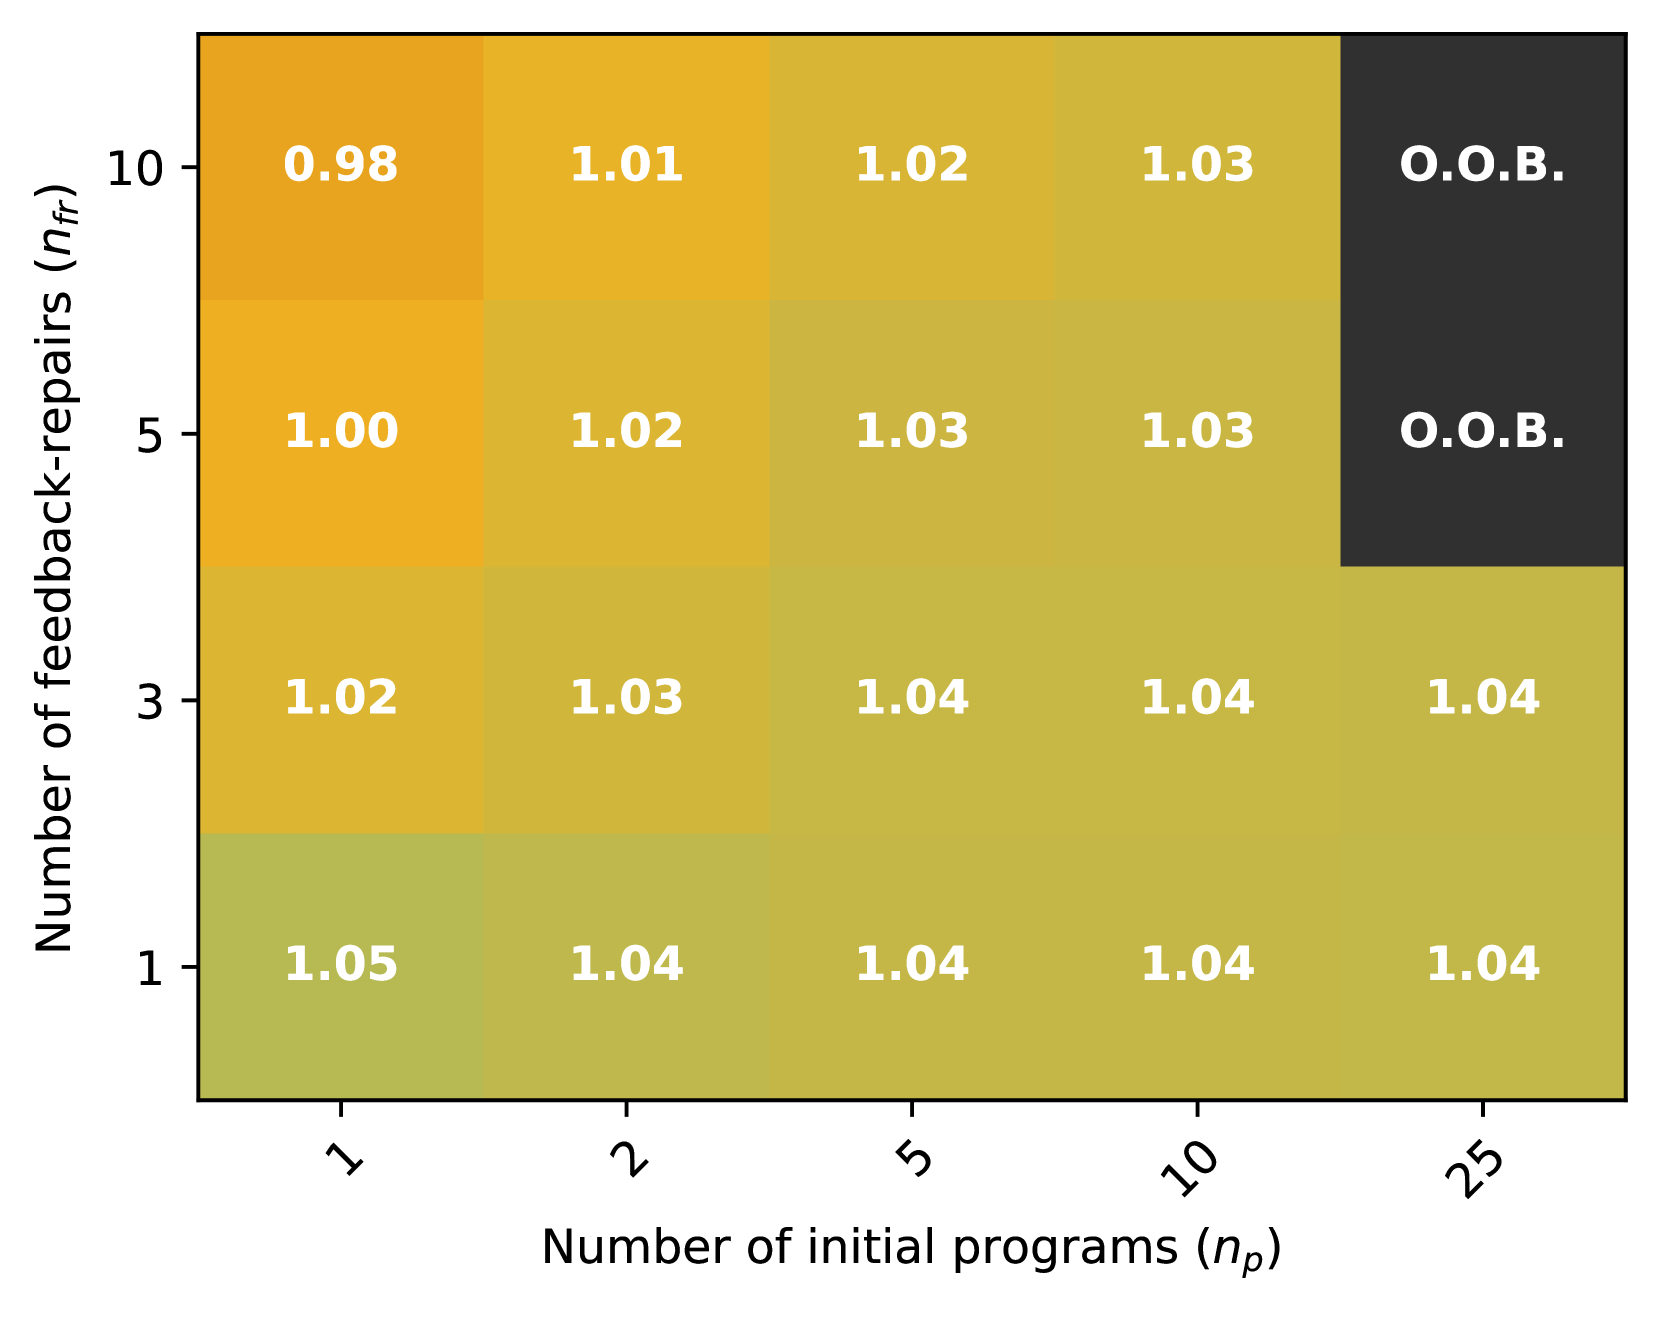
The image is a heatmap visualizing a performance metric as a function of two parameters: the number of feedback repairs (nfr) and the number of initial programs (np). The color intensity represents the value of the performance metric, with darker shades generally indicating higher values. The heatmap also indicates when the process goes "Out of Bounds" (O.O.B.).
### Components/Axes
* **X-axis:** Number of initial programs (np), with values 1, 2, 5, 10, and 25.
* **Y-axis:** Number of feedback-repairs (nfr), with values 1, 3, 5, and 10.
* **Color Scale:** The color scale is not explicitly shown, but the color intensity varies from light yellow to dark orange, with darker colors representing higher values. A dark gray color indicates "O.O.B." (Out of Bounds).
* **Labels:** The cells of the heatmap contain numerical values representing the performance metric.
### Detailed Analysis
The heatmap displays the performance metric for different combinations of the number of feedback repairs (nfr) and the number of initial programs (np).
Here's a breakdown of the values:
| nfr \ np | 1 | 2 | 5 | 10 | 25 |
| :------- | :---- | :---- | :---- | :---- | :----- |
| 10 | 0.98 | 1.01 | 1.02 | 1.03 | O.O.B. |
| 5 | 1.00 | 1.02 | 1.03 | 1.03 | O.O.B. |
| 3 | 1.02 | 1.03 | 1.04 | 1.04 | 1.04 |
| 1 | 1.05 | 1.04 | 1.04 | 1.04 | 1.04 |
* **nfr = 10:**
* np = 1: 0.98
* np = 2: 1.01
* np = 5: 1.02
* np = 10: 1.03
* np = 25: O.O.B. (Out of Bounds)
* **nfr = 5:**
* np = 1: 1.00
* np = 2: 1.02
* np = 5: 1.03
* np = 10: 1.03
* np = 25: O.O.B. (Out of Bounds)
* **nfr = 3:**
* np = 1: 1.02
* np = 2: 1.03
* np = 5: 1.04
* np = 10: 1.04
* np = 25: 1.04
* **nfr = 1:**
* np = 1: 1.05
* np = 2: 1.04
* np = 5: 1.04
* np = 10: 1.04
* np = 25: 1.04
### Key Observations
* The performance metric generally increases as the number of initial programs (np) increases, up to a point.
* For nfr = 3 and nfr = 1, the performance metric plateaus at np = 5.
* For nfr = 5 and nfr = 10, the process goes "Out of Bounds" (O.O.B.) when np = 25.
* The highest performance metric value is 1.05, achieved when nfr = 1 and np = 1.
* The lowest performance metric value is 0.98, achieved when nfr = 10 and np = 1.
### Interpretation
The heatmap suggests that increasing the number of initial programs (np) generally improves the performance metric, but only up to a certain point. Beyond that point, the performance either plateaus or the process becomes unstable and goes "Out of Bounds." The optimal combination of nfr and np depends on the specific application, but the heatmap provides a visual representation of the trade-offs involved. The "Out of Bounds" condition for higher nfr values (5 and 10) when np is 25 indicates a potential instability or resource limitation in the system being modeled. The data suggests that a lower number of feedback repairs (nfr = 1 or 3) is more stable across a wider range of initial programs (np).