\n
## Heatmap: Feedback-Repairs vs. Initial Programs
### Overview
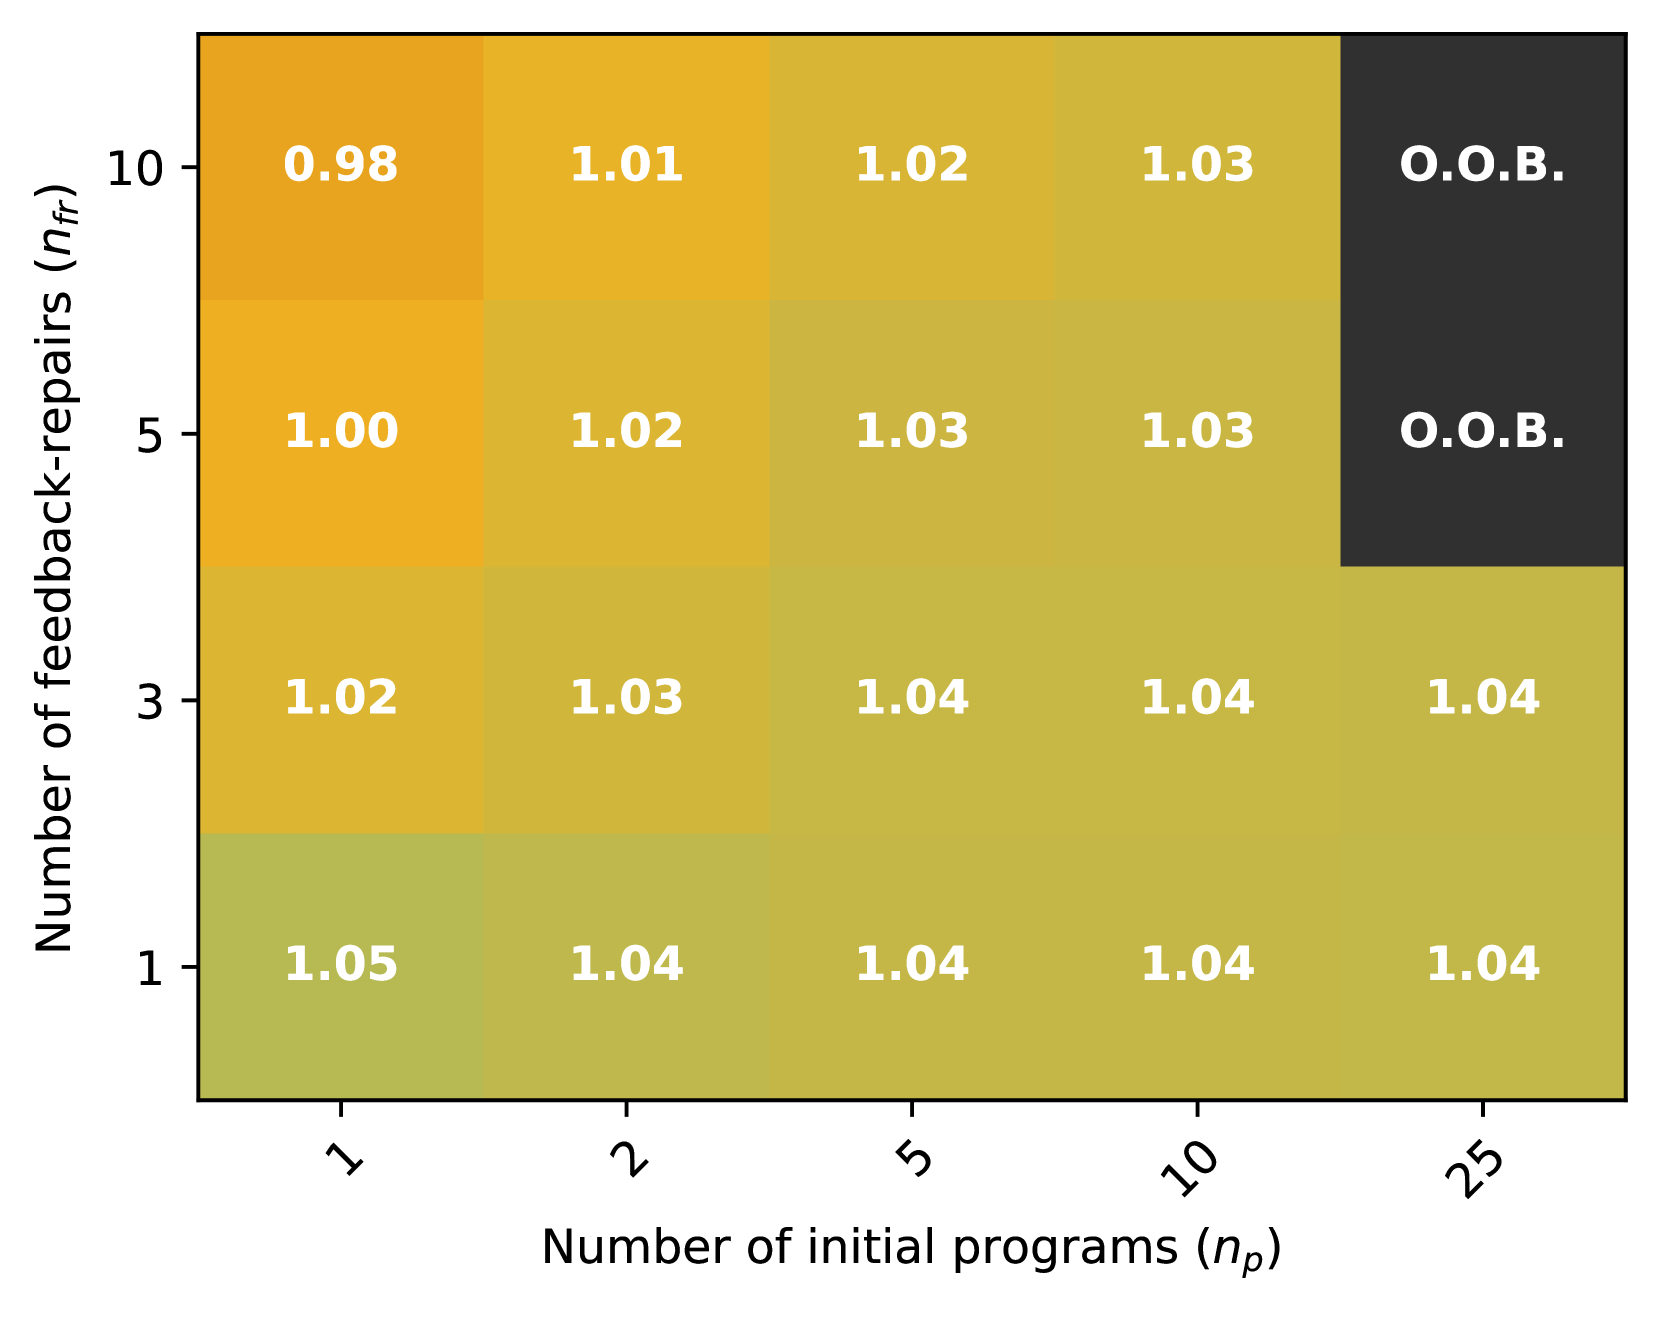
This image presents a heatmap visualizing the relationship between the number of initial programs (n<sub>p</sub>) and the number of feedback-repairs (n<sub>f</sub>). The heatmap uses a color gradient to represent numerical values, with lighter shades indicating lower values and darker shades indicating higher values. Some cells contain the abbreviation "O.O.B." which likely stands for "Out Of Bounds".
### Components/Axes
* **X-axis:** Number of initial programs (n<sub>p</sub>) with markers at 1, 2, 5, 10, and 25.
* **Y-axis:** Number of feedback-repairs (n<sub>f</sub>) with markers at 1, 3, 5, and 10.
* **Color Scale:** A gradient from light yellow to dark brown, representing the numerical values.
* **Data Values:** Numerical values are displayed within each cell of the heatmap.
* **Legend:** There is no explicit legend, but the color gradient serves as an implicit legend.
### Detailed Analysis
The heatmap is a 4x5 grid. The values within the grid are as follows:
* **n<sub>f</sub> = 1:**
* n<sub>p</sub> = 1: 1.05
* n<sub>p</sub> = 2: 1.04
* n<sub>p</sub> = 5: 1.04
* n<sub>p</sub> = 10: 1.04
* n<sub>p</sub> = 25: 1.04
* **n<sub>f</sub> = 3:**
* n<sub>p</sub> = 1: 1.02
* n<sub>p</sub> = 2: 1.03
* n<sub>p</sub> = 5: 1.04
* n<sub>p</sub> = 10: 1.04
* n<sub>p</sub> = 25: 1.04
* **n<sub>f</sub> = 5:**
* n<sub>p</sub> = 1: 1.00
* n<sub>p</sub> = 2: 1.02
* n<sub>p</sub> = 5: 1.03
* n<sub>p</sub> = 10: 1.03
* n<sub>p</sub> = 25: O.O.B.
* **n<sub>f</sub> = 10:**
* n<sub>p</sub> = 1: 0.98
* n<sub>p</sub> = 2: 1.01
* n<sub>p</sub> = 5: 1.02
* n<sub>p</sub> = 10: 1.03
* n<sub>p</sub> = 25: O.O.B.
The values generally increase as both n<sub>p</sub> and n<sub>f</sub> increase, with the exception of the first cell (n<sub>f</sub>=1, n<sub>p</sub>=1) having a relatively high value of 1.05. The cells corresponding to n<sub>f</sub> = 5 or 10 and n<sub>p</sub> = 25 are marked as "O.O.B."
### Key Observations
* The values are clustered around 1.0, suggesting a relatively small deviation from a baseline.
* The "O.O.B." values indicate that the model or calculation is invalid or undefined for these combinations of n<sub>f</sub> and n<sub>p</sub>.
* The highest value is 1.05, occurring when n<sub>f</sub> = 1 and n<sub>p</sub> = 1.
* The lowest value is 0.98, occurring when n<sub>f</sub> = 10 and n<sub>p</sub> = 1.
### Interpretation
This heatmap likely represents the results of a simulation or experiment investigating the impact of feedback-repairs on the performance of initial programs. The values likely represent a metric of performance, where values closer to 1.0 indicate better performance. The "O.O.B." values suggest that the system becomes unstable or undefined when a large number of initial programs (25) are combined with a significant number of feedback-repairs (5 or 10).
The initial increase in values as both n<sub>f</sub> and n<sub>p</sub> increase could indicate that a moderate amount of feedback-repair is beneficial for improving the performance of initial programs. However, the "O.O.B." values suggest that there is a limit to the number of feedback-repairs that can be applied without causing the system to fail. The higher value at n<sub>f</sub>=1, n<sub>p</sub>=1 could indicate that the initial programs are already relatively well-performing, and additional feedback-repairs do not significantly improve performance.
The data suggests a trade-off between the number of initial programs and the number of feedback-repairs. Finding the optimal balance between these two factors is crucial for maximizing performance and avoiding instability.