## Heatmap: Relationship Between Initial Programs and Feedback-Repairs
### Overview
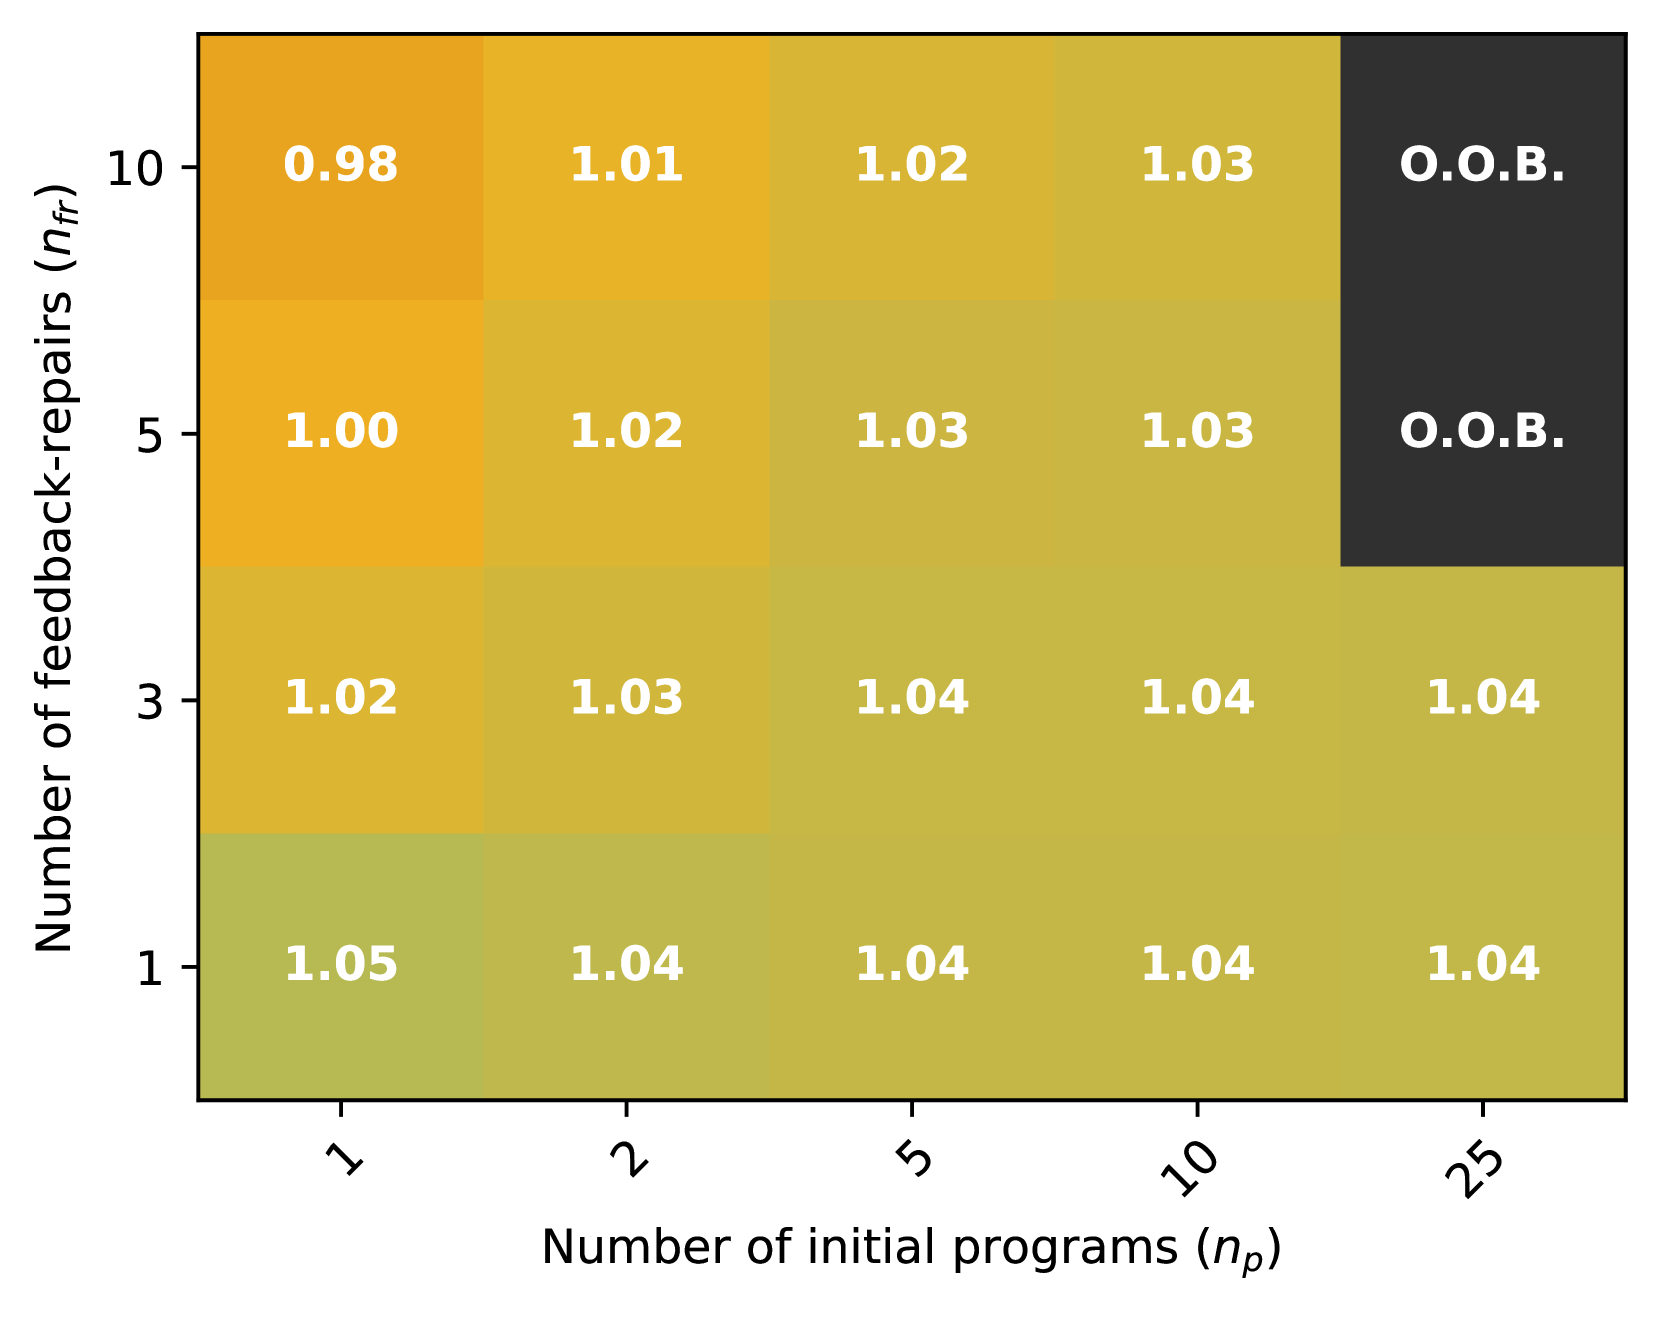
The image is a heatmap visualizing a numerical metric (values ranging from 0.98 to 1.05, plus "O.O.B.") across a grid defined by two variables: the "Number of initial programs (n_p)" on the horizontal axis and the "Number of feedback-repairs (n_fr)" on the vertical axis. The color of each cell corresponds to its value, creating a gradient from greenish-yellow (higher values) to orange (lower values), with dark gray indicating "O.O.B." (Out Of Bounds).
### Components/Axes
* **X-Axis (Horizontal):** Labeled "Number of initial programs (n_p)". The axis markers are categorical, not linear, with the following values from left to right: **1, 2, 5, 10, 25**.
* **Y-Axis (Vertical):** Labeled "Number of feedback-repairs (n_fr)". The axis markers are also categorical, with the following values from bottom to top: **1, 3, 5, 10**.
* **Data Grid:** A 4-row by 5-column grid (20 cells total). Each cell contains a numerical value or the text "O.O.B.".
* **Color Scale (Implied Legend):** The color of each cell represents its value. The gradient suggests:
* **Greenish-Yellow:** Highest values (~1.04-1.05).
* **Yellow-Gold:** Mid-range values (~1.02-1.03).
* **Orange:** Lower values (~0.98-1.01).
* **Dark Gray:** "O.O.B." cells, indicating an out-of-bounds or invalid condition.
### Detailed Analysis
The following table reconstructs the data from the heatmap. The cell value is listed for each combination of `n_p` (column) and `n_fr` (row).
| n_fr \ n_p | **1** | **2** | **5** | **10** | **25** |
| :--- | :--- | :--- | :--- | :--- | :--- |
| **10** | 0.98 | 1.01 | 1.02 | 1.03 | **O.O.B.** |
| **5** | 1.00 | 1.02 | 1.03 | 1.03 | **O.O.B.** |
| **3** | 1.02 | 1.03 | 1.04 | 1.04 | 1.04 |
| **1** | 1.05 | 1.04 | 1.04 | 1.04 | 1.04 |
**Trend Verification:**
* **Horizontal Trend (Increasing n_p):** For a fixed `n_fr`, the value generally **decreases slightly or stabilizes** as `n_p` increases. For example, at `n_fr=1`, the value drops from 1.05 (n_p=1) to 1.04 (n_p=2,5,10,25). At `n_fr=10`, it increases from 0.98 to 1.03 before hitting O.O.B.
* **Vertical Trend (Increasing n_fr):** For a fixed `n_p`, the value generally **decreases** as `n_fr` increases. For example, at `n_p=1`, the value drops from 1.05 (n_fr=1) to 0.98 (n_fr=10). This downward trend is consistent across all columns until the O.O.B. threshold.
### Key Observations
1. **Maximum Value:** The highest recorded value is **1.05**, located at the bottom-left corner (`n_p=1`, `n_fr=1`).
2. **Minimum Value:** The lowest numerical value is **0.98**, located at the top-left corner (`n_p=1`, `n_fr=10`).
3. **Plateau Region:** The bottom-right quadrant of the heatmap (where `n_p >= 5` and `n_fr <= 3`) shows a plateau of stable values at **1.04**.
4. **Out-of-Bounds (O.O.B.) Zone:** The two cells in the top-right corner (`n_p=25` for `n_fr=5` and `n_fr=10`) are marked "O.O.B.". This indicates that the combination of a high number of initial programs (25) with a high number of feedback-repairs (5 or 10) results in an invalid, undefined, or failed state for the measured metric.
5. **Color-Value Correlation:** The color gradient aligns with the numerical trend: cells with higher values (e.g., 1.05) are a cooler greenish-yellow, while cells with lower values (e.g., 0.98) are a warmer orange.
### Interpretation
This heatmap likely illustrates the performance or efficiency of a system (e.g., a program repair tool, an optimization algorithm) under different resource configurations. The metric (values ~1.0) could represent a ratio, such as speedup, success rate, or quality score relative to a baseline.
* **Trade-off Relationship:** The data suggests a trade-off. Increasing the initial pool of programs (`n_p`) provides diminishing returns and can slightly lower the metric. Conversely, increasing the number of feedback-repairs (`n_fr`) consistently reduces the metric. The most favorable outcome (1.05) occurs with minimal resources on both axes (`n_p=1`, `n_fr=1`).
* **System Limits:** The "O.O.B." zone defines a clear operational boundary. The system cannot handle or produces invalid results for configurations where both the initial program count and repair iterations are high. This could be due to computational limits, error accumulation, or a breakdown in the underlying model's assumptions.
* **Optimal Operating Region:** The plateau at 1.04 suggests a stable, sub-optimal operating region where increasing resources (`n_p` up to 25) does not degrade performance further, provided the number of repairs (`n_fr`) is kept low (≤3). This might represent a "safe" configuration space for the system.
In essence, the chart demonstrates that "more" is not always better. The system performs best with a focused, minimal initial set and few repair cycles, and it fails when pushed to extremes on both parameters simultaneously.