## Heatmap: Relationship Between Feedback-Repairs and Initial Programs
### Overview
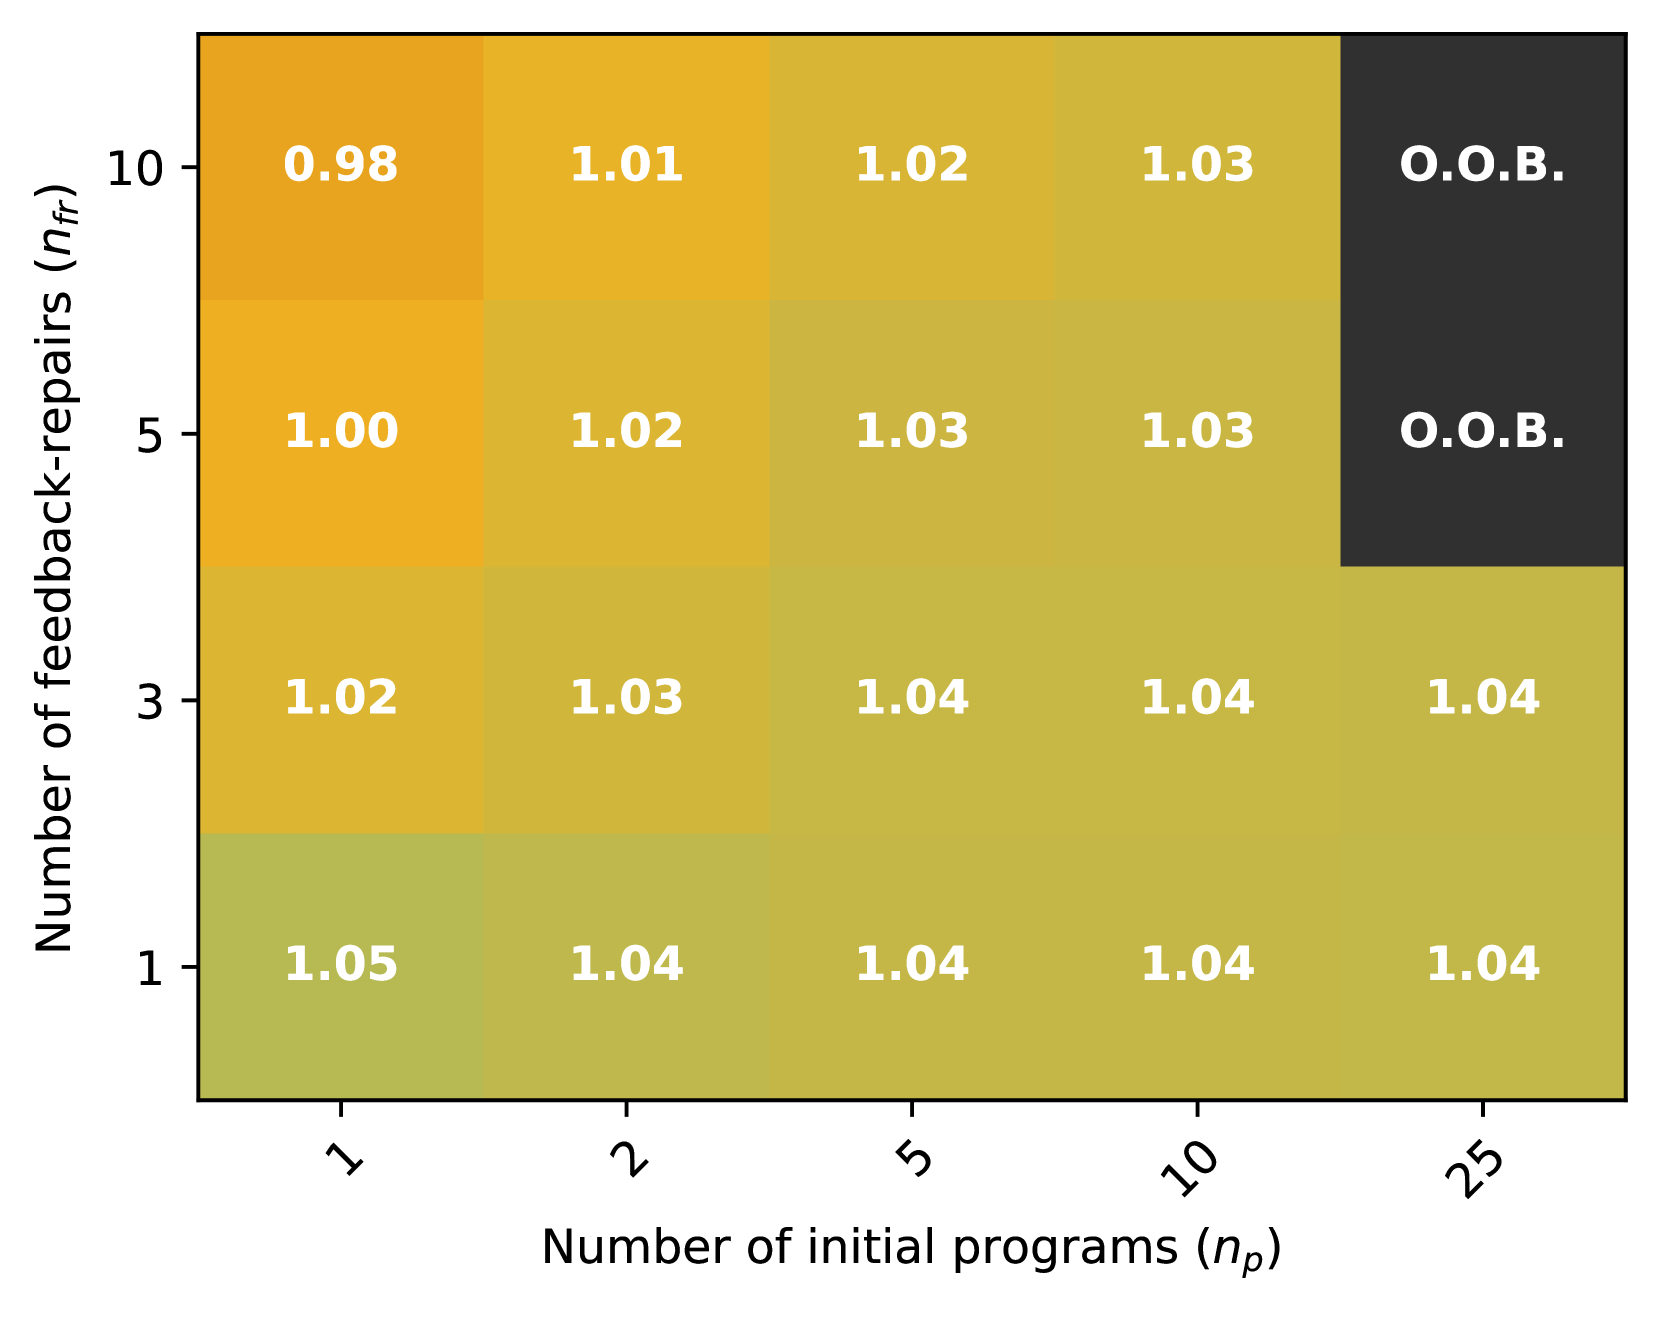
The image is a heatmap visualizing the relationship between the number of feedback-repairs (`n_fr`) and the number of initial programs (`n_p`). Values in each cell represent a metric (likely a ratio or efficiency score), with colors transitioning from orange (low values) to dark green (high values). The top-right corner contains "O.O.B." (Out of Bounds) annotations.
---
### Components/Axes
- **Y-Axis (Vertical)**:
- Label: "Number of feedback-repairs (`n_fr`)"
- Scale: Discrete values `[1, 3, 5, 10]`
- **X-Axis (Horizontal)**:
- Label: "Number of initial programs (`n_p`)"
- Scale: Discrete values `[1, 2, 5, 10, 25]`
- **Color Legend**:
- Implied gradient: Orange (low values) → Dark Green (high values)
- No explicit legend present; color intensity correlates with numerical values.
---
### Detailed Analysis
#### Cell Values and Trends
1. **`n_fr = 10` (Top Row)**:
- `n_p = 1`: `0.98` (orange)
- `n_p = 2`: `1.01` (light orange)
- `n_p = 5`: `1.02` (medium orange)
- `n_p = 10`: `1.03` (light green)
- `n_p = 25`: `O.O.B.` (black)
2. **`n_fr = 5` (Second Row)**:
- `n_p = 1`: `1.00` (orange)
- `n_p = 2`: `1.02` (light orange)
- `n_p = 5`: `1.03` (light green)
- `n_p = 10`: `1.03` (light green)
- `n_p = 25`: `O.O.B.` (black)
3. **`n_fr = 3` (Third Row)**:
- `n_p = 1`: `1.02` (light orange)
- `n_p = 2`: `1.03` (light green)
- `n_p = 5`: `1.04` (medium green)
- `n_p = 10`: `1.04` (medium green)
- `n_p = 25`: `1.04` (medium green)
4. **`n_fr = 1` (Bottom Row)**:
- `n_p = 1`: `1.05` (dark green)
- `n_p = 2`: `1.04` (medium green)
- `n_p = 5`: `1.04` (medium green)
- `n_p = 10`: `1.04` (medium green)
- `n_p = 25`: `1.04` (medium green)
#### Color Consistency Check
- Values increase from orange to dark green as numbers rise.
- `O.O.B.` cells (black) are isolated in the top-right corner, confirming they represent undefined/non-applicable data.
---
### Key Observations
1. **General Trend**:
- Values increase with higher `n_p` and `n_fr`, suggesting a positive correlation between initial programs and feedback-repairs.
- The metric plateaus at `1.04` for `n_fr ≥ 3` and `n_p ≥ 5`.
2. **Anomalies**:
- `O.O.B.` values at `n_p = 25` for `n_fr = 5` and `10` indicate a threshold where the metric becomes undefined.
- The lowest value (`0.98`) occurs at `n_fr = 10`, `n_p = 1`, suggesting inefficiency at low `n_p` with high `n_fr`.
3. **Color Gradient**:
- Darker green dominates the lower-left quadrant (`n_fr = 1`, `n_p = 1`), while lighter shades appear in the upper-right quadrant.
---
### Interpretation
- **Relationship**: The heatmap implies that increasing `n_p` generally improves the metric (e.g., efficiency, success rate), but only up to a point. Beyond `n_p = 10`, the metric stabilizes or becomes undefined (`O.O.B.`).
- **Thresholds**:
- `n_p = 25` triggers `O.O.B.` for `n_fr ≥ 5`, suggesting system limitations or data collection constraints at extreme scales.
- `n_fr = 1` consistently yields the highest values (`1.05` at `n_p = 1`), possibly indicating optimal performance with minimal feedback-repairs.
- **Practical Implications**:
- Organizations should balance `n_p` and `n_fr` to maximize the metric. Exceeding `n_p = 10` may not yield benefits and could introduce instability.
- The `O.O.B.` values highlight the need for further investigation into why the metric fails at high `n_p`.
---
### Spatial Grounding
- **Legend**: Implied via color gradient; no explicit legend present.
- **Text Placement**:
- Axis labels are left-aligned (y-axis) and bottom-aligned (x-axis).
- `O.O.B.` annotations are centered in the top-right cells.
- **Color Matching**:
- Dark green corresponds to `1.04–1.05`, light green to `1.02–1.03`, and orange to `0.98–1.01`.
---
### Final Notes
The heatmap provides actionable insights into optimizing `n_p` and `n_fr` but leaves open questions about the cause of `O.O.B.` values. Further analysis of system constraints or data collection methods at high `n_p` is warranted.