\n
## Diagram: State Transition Diagram
### Overview
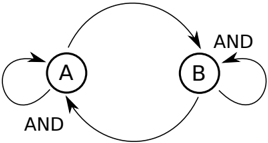
The image depicts a state transition diagram with two states, labeled 'A' and 'B'. Arrows indicate transitions between these states, and the label "AND" is associated with each transition. Each state also has a self-loop, also labeled "AND".
### Components/Axes
The diagram consists of:
* **States:** Two circular states labeled 'A' and 'B'.
* **Transitions:** Arrows connecting the states, labeled "AND".
* **Self-Loops:** Arrows originating and terminating within each state, labeled "AND".
### Detailed Analysis or Content Details
* **State A:** Has a self-loop labeled "AND". An arrow transitions from A to B, labeled "AND".
* **State B:** Has a self-loop labeled "AND". An arrow transitions from B to A, labeled "AND".
* **Transitions:** The diagram shows a bidirectional flow between states A and B, with each transition triggered by the condition "AND".
* **Self-Loops:** Each state can remain in itself, also triggered by the condition "AND".
### Key Observations
The diagram represents a system that can exist in either state A or state B, and transitions between these states are governed by the "AND" condition. The self-loops suggest that the system can remain in a given state if the "AND" condition is met. The diagram does not provide any quantitative data or specific values.
### Interpretation
This diagram likely represents a logical or computational process. The states 'A' and 'B' could represent different conditions or values within a system. The "AND" condition suggests that a specific logical operation must be true for a transition to occur or for the system to remain in its current state. The bidirectional flow indicates a cyclical process where the system can move back and forth between states A and B based on the evaluation of the "AND" condition. Without further context, it's difficult to determine the precise meaning of the states and the "AND" condition, but it clearly illustrates a state machine or a similar type of system. The diagram is a visual representation of a logical relationship, not a data-driven chart.