## Diagram: DAG LSTM Workflow
### Overview
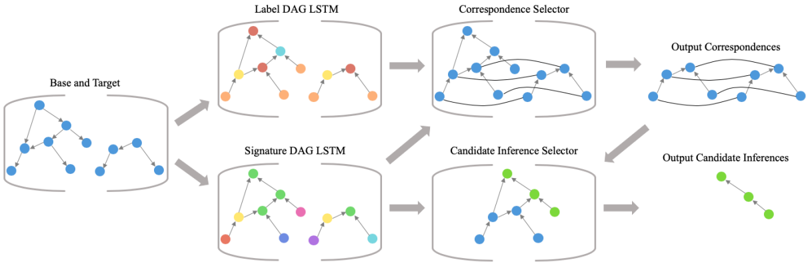
The image illustrates a workflow using Directed Acyclic Graph (DAG) Long Short-Term Memory (LSTM) networks for correspondence and inference selection. It shows the progression from base and target graphs through label and signature DAG LSTMs, followed by correspondence and candidate inference selectors, and finally, the output correspondences and candidate inferences.
### Components/Axes
* **Base and Target:** Initial input graphs, consisting of blue nodes connected by lines.
* **Label DAG LSTM:** Processes the base and target graphs, assigning different colors to the nodes (red, cyan, orange, yellow).
* **Signature DAG LSTM:** Processes the base and target graphs, assigning different colors to the nodes (green, yellow, red, pink, purple).
* **Correspondence Selector:** Selects correspondences between nodes in the graphs, represented by blue nodes and connecting lines.
* **Candidate Inference Selector:** Selects candidate inferences from the graphs, represented by blue and green nodes connected by lines.
* **Output Correspondences:** The final output of the correspondence selection process, consisting of blue nodes and connecting lines.
* **Output Candidate Inferences:** The final output of the candidate inference selection process, consisting of green nodes and connecting lines.
* **Arrows:** Gray arrows indicate the flow of data between the different stages of the workflow.
### Detailed Analysis or ### Content Details
1. **Base and Target:**
* Two separate graphs are shown, both consisting of blue nodes connected by lines.
* The graph on the left has more nodes and a more complex structure than the graph on the right.
2. **Label DAG LSTM:**
* The input graphs are processed, and the nodes are assigned different colors.
* The colors used are red, cyan, orange, and yellow.
* The structure of the graphs remains similar to the base and target graphs.
3. **Signature DAG LSTM:**
* The input graphs are processed, and the nodes are assigned different colors.
* The colors used are green, yellow, red, pink, and purple.
* The structure of the graphs remains similar to the base and target graphs.
4. **Correspondence Selector:**
* The graphs are transformed into a new representation with blue nodes and connecting lines.
* The lines connecting the nodes appear to represent correspondences between nodes in the original graphs.
5. **Candidate Inference Selector:**
* The graphs are transformed into a new representation with blue and green nodes connected by lines.
* The green nodes appear to represent candidate inferences.
6. **Output Correspondences:**
* The final output is a graph of blue nodes connected by lines, representing the selected correspondences.
7. **Output Candidate Inferences:**
* The final output is a graph of green nodes connected by lines, representing the selected candidate inferences.
### Key Observations
* The workflow involves processing base and target graphs using DAG LSTM networks.
* The label and signature DAG LSTMs assign different colors to the nodes, possibly representing different features or attributes.
* The correspondence and candidate inference selectors extract relevant information from the processed graphs.
* The final outputs are graphs representing the selected correspondences and candidate inferences.
### Interpretation
The diagram illustrates a method for identifying correspondences and inferences between two graphs using DAG LSTM networks. The label and signature DAG LSTMs likely encode information about the structure and features of the graphs, which are then used by the selectors to extract relevant information. The use of different colors in the intermediate stages suggests that the LSTMs are learning to represent different aspects of the graphs. The final outputs represent the results of the correspondence and inference selection processes, which could be used for various downstream tasks such as graph matching or knowledge graph completion.