## Diagram: DAG-based Machine Learning Pipeline
### Overview
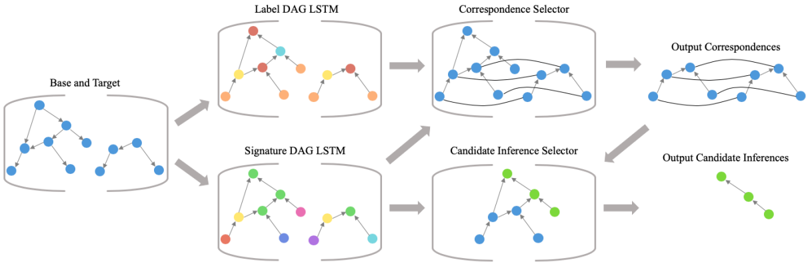
This diagram illustrates a computational architecture designed to process two Directed Acyclic Graphs (DAGs), labeled "Base and Target." The pipeline utilizes two parallel Long Short-Term Memory (LSTM) networks—"Label DAG LSTM" and "Signature DAG LSTM"—to extract features, which are then processed by "Correspondence Selector" and "Candidate Inference Selector" modules to produce final outputs.
### Components/Axes
The diagram is organized as a flow chart moving from left to right, with two parallel processing branches.
* **Input:** "Base and Target" (Far left). Contains two DAG structures consisting of identical blue nodes.
* **Processing Branch 1 (Top):**
* "Label DAG LSTM": Receives input from "Base and Target."
* "Correspondence Selector": Receives input from "Label DAG LSTM."
* **Processing Branch 2 (Bottom):**
* "Signature DAG LSTM": Receives input from "Base and Target."
* "Candidate Inference Selector": Receives input from "Signature DAG LSTM" and "Correspondence Selector."
* **Outputs (Far Right):**
* "Output Correspondences": Derived from the "Correspondence Selector."
* "Output Candidate Inferences": Derived from the "Candidate Inference Selector."
### Detailed Analysis
#### 1. Input Stage (Left)
* **Base and Target:** Displays two distinct DAGs. Each node is represented by a uniform blue circle. The structure consists of directed edges pointing towards child nodes.
#### 2. Feature Extraction Stage (Middle)
* **Label DAG LSTM (Top-middle):** The input DAGs are transformed. Nodes are now color-coded (Red, Cyan, Orange, Yellow), suggesting the assignment of specific labels or feature vectors to the nodes.
* **Signature DAG LSTM (Bottom-middle):** The input DAGs are transformed with a different color palette (Green, Yellow, Pink, Blue, Purple, Cyan), suggesting the extraction of structural "signatures" or topological features distinct from the label features.
#### 3. Selection and Inference Stage (Right)
* **Correspondence Selector (Top-right):** This module takes the labeled DAGs and identifies relationships between them.
* **Visual Trend:** The output shows the two DAGs with curved lines connecting nodes across the two graphs, representing identified correspondences.
* **Candidate Inference Selector (Bottom-right):** This module receives input from the "Signature DAG LSTM" and a secondary input from the "Correspondence Selector" (indicated by a diagonal arrow pointing from the Correspondence Selector to this block).
* **Visual Trend:** The output is a simplified, linear chain of three green nodes, representing a specific inferred relationship or path.
### Key Observations
* **Parallel Processing:** The architecture splits the input into two distinct feature-learning paths (Label vs. Signature), implying the model treats node identity and graph topology as separate information streams.
* **Cross-Module Dependency:** The "Candidate Inference Selector" is dependent on the "Correspondence Selector." This suggests that the model cannot perform high-level inference without first establishing the correspondences between the two input graphs.
* **Output Complexity:** The "Output Correspondences" maintains the complexity of the original graph structure (showing inter-graph links), whereas the "Output Candidate Inferences" simplifies the data into a specific, smaller chain of nodes.
### Interpretation
This diagram represents a neural network architecture likely used for **Graph Matching** or **Graph Alignment** tasks.
* **The Logic:** The system is designed to compare two graphs. By using two different LSTMs, the model is likely attempting to decouple "what the nodes are" (Label DAG LSTM) from "how the nodes are connected/structured" (Signature DAG LSTM).
* **The Flow:** The "Correspondence Selector" acts as a bridge, aligning the two graphs based on the label features. Once aligned, the "Candidate Inference Selector" uses this alignment to perform reasoning or inference, resulting in the final output.
* **Peircean/Technical Insight:** The architecture suggests a hierarchical reasoning process:
1. **Representation:** Encode node properties and structural signatures.
2. **Alignment:** Find the mapping between the two graphs.
3. **Inference:** Use the mapping to extract specific, relevant sub-structures or relationships (the "Candidate Inferences").