\n
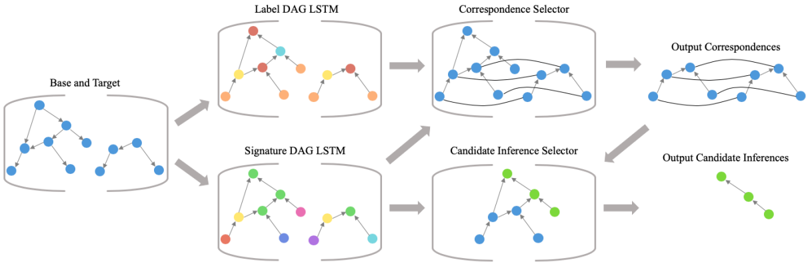
## Diagram: System Architecture for Graph Correspondence
### Overview
The image depicts a system architecture diagram illustrating a process for finding correspondences between two graphs, labeled "Base and Target". The process involves several stages: Label DAG LSTM, Signature DAG LSTM, Correspondence Selector, Candidate Inference Selector, and output stages for Correspondences and Inferences. The diagram uses directed acyclic graphs (DAGs) represented by nodes and edges, with different colors representing different elements or stages of the process.
### Components/Axes
The diagram is structured into six main components arranged horizontally:
1. **Base and Target:** Input graphs represented by blue nodes connected by edges.
2. **Label DAG LSTM:** A DAG with nodes colored red, orange, yellow, and green.
3. **Signature DAG LSTM:** A DAG with nodes colored purple, green, and blue.
4. **Correspondence Selector:** A DAG with nodes colored blue.
5. **Candidate Inference Selector:** A DAG with nodes colored green and blue.
6. **Output Correspondences & Output Candidate Inferences:** Representations of the output, with lines connecting corresponding nodes and green nodes representing inferences.
Arrows indicate the flow of information between these components. Each component is enclosed within a rounded rectangle with a semi-transparent gray fill.
### Detailed Analysis or Content Details
**1. Base and Target:**
* Two DAGs are present.
* Both graphs have approximately 7 nodes.
* Nodes are connected by directed edges.
* All nodes are colored blue.
**2. Label DAG LSTM:**
* The DAG has approximately 7 nodes.
* Node colors: Red (approximately 2 nodes), Orange (approximately 2 nodes), Yellow (approximately 2 nodes), Green (approximately 1 node).
* Edges connect nodes in a directed manner.
**3. Signature DAG LSTM:**
* The DAG has approximately 7 nodes.
* Node colors: Purple (approximately 3 nodes), Green (approximately 2 nodes), Blue (approximately 2 nodes).
* Edges connect nodes in a directed manner.
**4. Correspondence Selector:**
* The DAG has approximately 7 nodes.
* All nodes are colored blue.
* Edges connect nodes, and curved lines are drawn between some nodes, indicating correspondences.
**5. Candidate Inference Selector:**
* The DAG has approximately 5 nodes.
* Node colors: Green (approximately 3 nodes), Blue (approximately 2 nodes).
* Edges connect nodes in a directed manner.
**6. Output Correspondences:**
* Shows lines connecting corresponding nodes between the two original graphs.
* The lines are curved and colored black.
**7. Output Candidate Inferences:**
* Shows a series of green nodes connected by a single line.
* Approximately 3 nodes are present.
### Key Observations
* The system appears to transform the input graphs through multiple layers of LSTM-based DAGs.
* The color coding is consistent within each stage, suggesting different types of information or features are represented by each color.
* The Correspondence Selector and Candidate Inference Selector stages seem to refine the initial graph representations to identify correspondences and potential inferences.
* The output stages visually represent the identified correspondences and candidate inferences.
### Interpretation
This diagram illustrates a system for graph matching and inference. The "Base and Target" graphs represent the input data, and the subsequent stages process this data to find relationships between the nodes in the two graphs. The use of LSTMs suggests that the system is capable of learning and representing complex relationships within the graphs. The "Label DAG LSTM" and "Signature DAG LSTM" likely extract features or representations of the graphs, while the "Correspondence Selector" and "Candidate Inference Selector" use these representations to identify corresponding nodes and potential inferences. The final output stages visualize the results of this process.
The diagram suggests a pipeline approach to graph correspondence, where each stage builds upon the previous one to refine the results. The use of DAGs allows for representing complex relationships and dependencies between nodes. The system could be used for various applications, such as knowledge graph alignment, image matching, or protein-protein interaction prediction. The diagram does not provide quantitative data, but it clearly outlines the architecture and flow of information within the system. The system appears to be designed to identify both direct correspondences between nodes and potential inferences based on the graph structure.