## Flowchart: Multi-Stage Data Processing Pipeline
### Overview
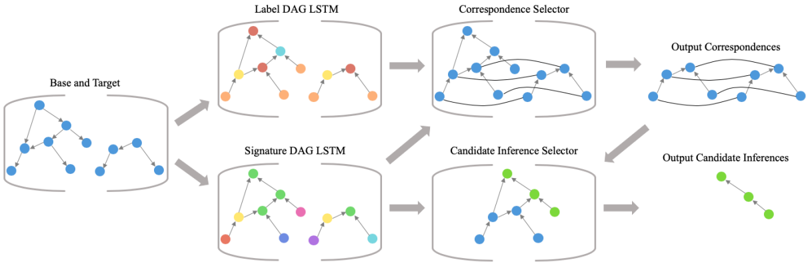
The image depicts a technical workflow for processing graph-structured data through a series of machine learning components. It illustrates a pipeline that transforms base and target graphs into structured correspondences and candidate inferences using label and signature DAG LSTMs, followed by selector mechanisms.
### Components/Axes
1. **Base and Target** (Leftmost block)
- Contains two graph structures with blue nodes
- Represents input data structures
2. **Label DAG LSTM** (Top middle block)
- Processes Base/Target into colored nodes (red, yellow, orange)
- Outputs to Correspondence Selector
3. **Signature DAG LSTM** (Bottom middle block)
- Processes Base/Target into colored nodes (green, purple, cyan)
- Outputs to Candidate Inference Selector
4. **Correspondence Selector** (Top right block)
- Takes output from Label DAG LSTM
- Produces Output Correspondences (blue nodes with connecting lines)
5. **Candidate Inference Selector** (Bottom right block)
- Takes output from Signature DAG LSTM
- Produces Output Candidate Inferences (green nodes with connecting lines)
### Flow Direction
- Arrows indicate data flow from left to right
- Base/Target → Label DAG LSTM → Correspondence Selector → Output Correspondences
- Base/Target → Signature DAG LSTM → Candidate Inference Selector → Output Candidate Inferences
### Key Observations
1. **Color Coding**:
- Label DAG LSTM uses warm colors (red/orange/yellow)
- Signature DAG LSTM uses cool colors (green/purple/cyan)
- Output Correspondences use blue nodes
- Output Candidate Inferences use green nodes
2. **Graph Transformation**:
- Input graphs (blue nodes) are transformed into DAG structures through LSTM processing
- Selectors refine these into final output structures with specific node color patterns
3. **Parallel Processing**:
- Two independent processing streams (Label vs Signature) handle different aspects of the input data
- Both streams converge on final output types (correspondences and inferences)
### Interpretation
This diagram represents a graph neural network architecture for relational data analysis. The Base and Target graphs likely represent input relational structures (e.g., social networks, molecular structures). The Label and Signature DAG LSTMs perform different types of graph representation learning:
- Label DAG LSTM focuses on structural correspondence learning (red/yellow/orange nodes)
- Signature DAG LSTM captures graph signatures for inference tasks (green/purple/cyan nodes)
The Correspondence Selector and Candidate Inference Selector act as attention mechanisms, refining the LSTM outputs into final predictions. The color coding suggests different feature spaces or confidence levels in the learned representations. The parallel processing streams indicate a multi-task learning approach where the model simultaneously learns structural correspondences and inference capabilities from the same input data.
The architecture demonstrates how graph neural networks can decompose complex relational data processing into modular components, each specializing in different aspects of the learning task. The final outputs (correspondences and inferences) likely represent different types of predictions or relationships that the model has learned from the input graphs.