## Line Chart: Comparative NMSE Performance Across Scenarios
### Overview
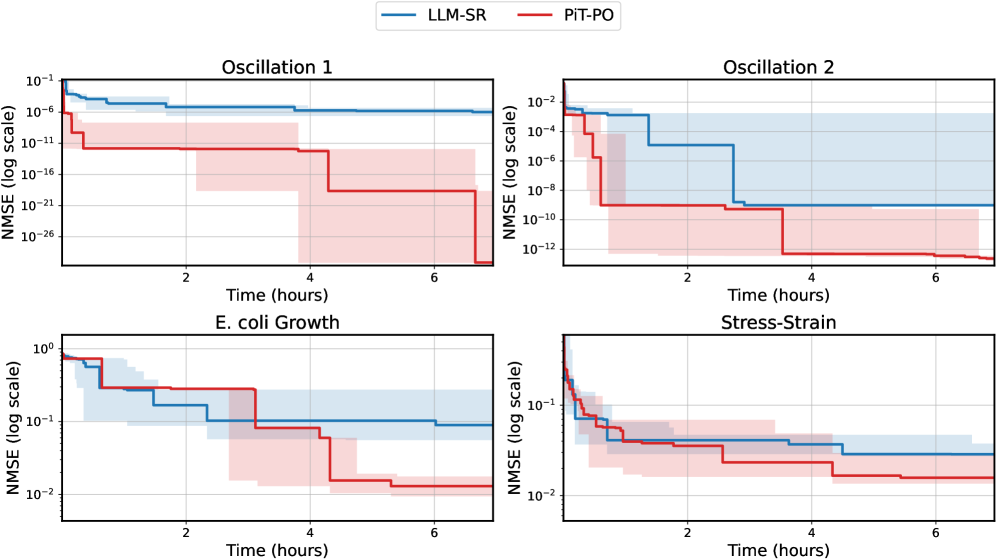
The image displays four line charts comparing the Normalized Mean Squared Error (NMSE) performance of two models (LLM-SR and PIT-PO) across four scenarios: Oscillation 1, Oscillation 2, E. coli Growth, and Stress-Strain. NMSE values are plotted on a logarithmic scale against time (hours). Both models show stepwise improvements in performance over time, with LLM-SR consistently outperforming PIT-PO.
### Components/Axes
- **X-axis**: Time (hours), ranging from 0 to 6 hours in all charts.
- **Y-axis**: NMSE (log scale), with varying ranges:
- Oscillation 1 & 2: 10⁻¹ to 10⁻²⁶
- E. coli Growth & Stress-Strain: 10⁰ to 10⁻²
- **Legend**: Located at the top center, with:
- **Blue line**: LLM-SR
- **Red line**: PIT-PO
- **Shaded regions**: Confidence intervals (error bounds) around each line.
### Detailed Analysis
#### Oscillation 1
- **LLM-SR (Blue)**:
- Starts at ~10⁻¹ at 0h.
- Drops sharply to ~10⁻⁶ at 2h.
- Remains stable at ~10⁻⁶ until 6h.
- **PIT-PO (Red)**:
- Starts at ~10⁻¹ at 0h.
- Drops to ~10⁻¹⁶ at 2h.
- Further decreases to ~10⁻²¹ at 4h.
- Reaches ~10⁻²⁶ at 6h.
- **Confidence Intervals**: Widen significantly at 2h and 4h for PIT-PO.
#### Oscillation 2
- **LLM-SR (Blue)**:
- Starts at ~10⁻¹ at 0h.
- Drops to ~10⁻⁴ at 2h.
- Remains stable at ~10⁻⁴ until 6h.
- **PIT-PO (Red)**:
- Starts at ~10⁻¹ at 0h.
- Drops to ~10⁻⁸ at 2h.
- Further decreases to ~10⁻¹⁰ at 4h.
- Reaches ~10⁻¹² at 6h.
- **Confidence Intervals**: Expand at 2h and 4h for PIT-PO.
#### E. coli Growth
- **LLM-SR (Blue)**:
- Starts at ~10⁰ at 0h.
- Drops to ~10⁻¹ at 2h.
- Remains stable at ~10⁻¹ until 6h.
- **PIT-PO (Red)**:
- Starts at ~10⁰ at 0h.
- Drops to ~10⁻² at 2h.
- Further decreases to ~10⁻³ at 4h.
- Reaches ~10⁻⁴ at 6h.
- **Confidence Intervals**: Narrower compared to oscillation scenarios.
#### Stress-Strain
- **LLM-SR (Blue)**:
- Starts at ~10⁻¹ at 0h.
- Drops to ~10⁻² at 2h.
- Remains stable at ~10⁻² until 6h.
- **PIT-PO (Red)**:
- Starts at ~10⁻¹ at 0h.
- Drops to ~10⁻³ at 2h.
- Further decreases to ~10⁻⁴ at 4h.
- Reaches ~10⁻⁵ at 6h.
- **Confidence Intervals**: Minimal expansion across time.
### Key Observations
1. **Performance Gap**: LLM-SR consistently achieves lower NMSE than PIT-PO in all scenarios.
2. **Stepwise Improvements**: Both models show abrupt performance gains at 2h and 4h, suggesting discrete optimization stages.
3. **Scale Variance**: Oscillation scenarios exhibit NMSE orders of magnitude lower than biological/mechanical systems.
4. **Confidence Uncertainty**: PIT-PO’s confidence intervals widen during performance drops, indicating higher variability in error estimation.
### Interpretation
The data demonstrates that LLM-SR outperforms PIT-PO across diverse applications, with the largest relative improvements in oscillation modeling (10⁻¹⁶ vs. 10⁻⁶ NMSE at 2h). The stepwise drops align with potential model retraining or data assimilation events. The logarithmic scale emphasizes the exponential decay in error for PIT-PO, though its wider confidence intervals suggest less reliable predictions despite lower NMSE. The biological/mechanical scenarios (E. coli, Stress-Strain) show higher baseline errors, implying greater complexity in modeling these systems. The consistent performance gap highlights LLM-SR’s robustness, while the confidence intervals caution against over-reliance on PIT-PO in high-stakes applications.