\n
## Simulation Control Panel & Bird Flock Visualization
### Overview
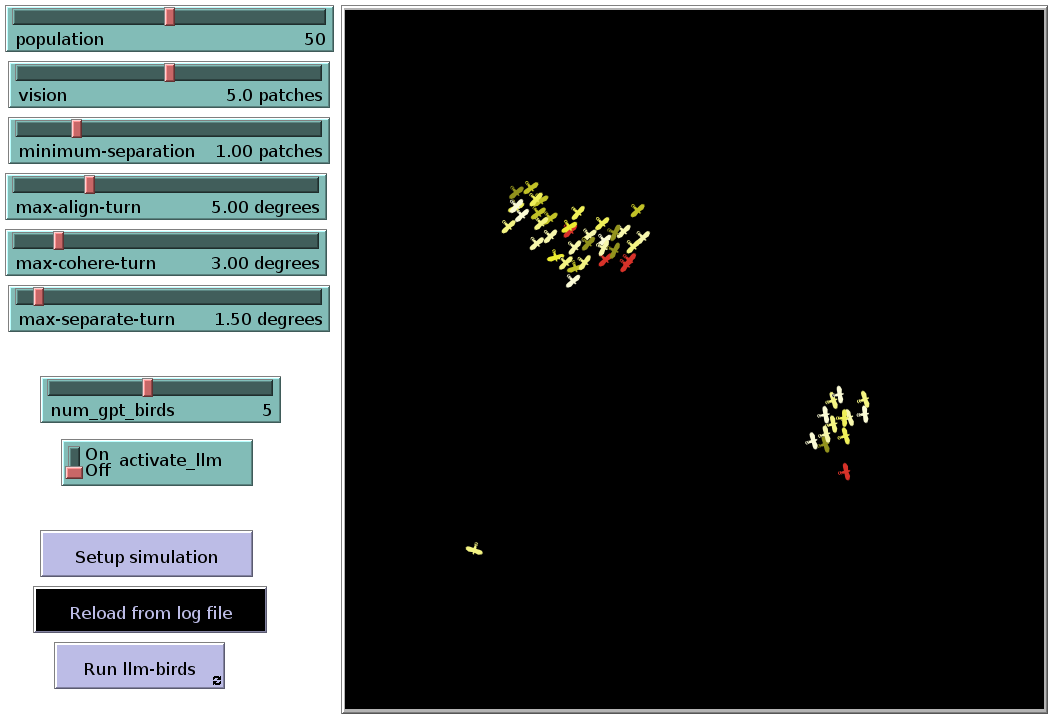
The image depicts a simulation control panel alongside a visualization of a bird flock. The control panel on the left allows adjustment of simulation parameters, while the main area displays the birds as green crosses, with a few highlighted in red. The background is black, suggesting a 2D environment.
### Components/Axes
The control panel contains the following adjustable parameters with their current values:
* **population**: 50
* **vision**: 5.0 patches
* **minimum-separation**: 1.00 patches
* **max-align-turn**: 5.00 degrees
* **max-cohere-turn**: 3.00 degrees
* **max-separate-turn**: 1.50 degrees
* **num\_gpt\_birds**: 5
* **activate\_llm**: OFF (toggle switch)
The panel also includes three buttons:
* **Setup simulation**
* **Reload from log file**
* **Run llm-birds**
The main visualization area does not have explicit axes, but represents a 2D space where the birds are positioned.
### Detailed Analysis or Content Details
The visualization shows two distinct clusters of birds.
* **Upper Cluster:** Approximately 30-40 birds are clustered tightly together in the upper-center of the image. Several birds within this cluster are highlighted in red (approximately 5-7). The birds are oriented in various directions, but generally face towards the center of the cluster.
* **Lower Cluster:** A smaller cluster of approximately 10-15 birds is located in the lower-center of the image. These birds are more dispersed than the upper cluster. One bird is highlighted in red.
* **Isolated Bird:** A single bird (green cross) is located near the bottom-center of the image, significantly separated from the other clusters.
The simulation parameters suggest the birds operate under rules governing population size, vision range, minimum separation distance, and turning angles (alignment, coherence, separation). The `num_gpt_birds` parameter is set to 5, and the `activate_llm` parameter is currently off.
### Key Observations
* The simulation appears to be demonstrating flocking behavior, with birds grouping together.
* The red birds may represent a subset of birds being tracked or analyzed.
* The isolated bird suggests the simulation allows for birds to temporarily or permanently separate from the main flock.
* The `activate_llm` parameter being off suggests that a Large Language Model (LLM) is not currently influencing the bird behavior.
### Interpretation
This image represents a simulation of a bird flocking algorithm, likely based on Reynolds' Boids model. The parameters on the left control the behavior of the birds, influencing how they align, cohere, and separate from each other. The visualization shows the emergent behavior of the flock, where individual birds follow simple rules to create a complex, coordinated movement.
The presence of the `num_gpt_birds` and `activate_llm` parameters suggests a potential extension to the traditional Boids model, where an LLM could be used to influence the behavior of a subset of the birds. The fact that the LLM is currently deactivated implies that the observed flocking behavior is solely driven by the core Boids rules.
The two clusters and the isolated bird could indicate different stages of flock formation or disruption. The red birds might be selected for observation, perhaps to analyze their individual trajectories or interactions with the flock. The simulation is likely used to study collective behavior, emergent properties, and the impact of different parameters on flock dynamics. The simulation is likely used to study collective behavior, emergent properties, and the impact of different parameters on flock dynamics.