## Simulation Interface: Bird Flocking Behavior Control Panel
### Overview
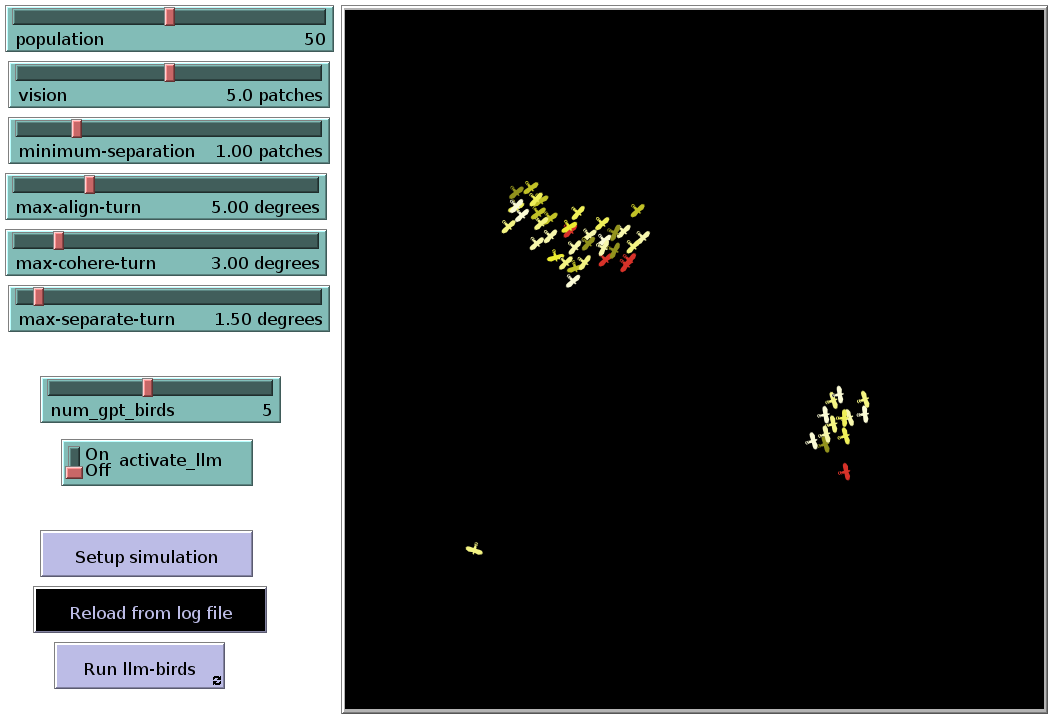
The image depicts a simulation interface for studying bird flocking behavior. The main area displays a flock of birds represented as colored crosses on a black background. A control panel on the left contains adjustable parameters, buttons, and a legend explaining the color coding of bird states.
### Components/Axes
#### Control Panel Elements
1. **Parameter Sliders** (vertical stack on left):
- **Population**: 50 (red indicator at midpoint)
- **Vision**: 5.0 patches (red indicator at midpoint)
- **Minimum-separation**: 1.00 patches (red indicator at 1/3 position)
- **Max-align-turn**: 5.00 degrees (red indicator at 1/3 position)
- **Max-cohere-turn**: 3.00 degrees (red indicator at 1/3 position)
- **Max-separate-turn**: 1.50 degrees (red indicator at 1/3 position)
- **Num_gpt_birds**: 5 (red indicator at midpoint)
2. **Toggle Switch**:
- **Activate_llm**: Off (red indicator)
3. **Buttons** (bottom of control panel):
- **Setup simulation** (light purple)
- **Reload from log file** (dark purple)
- **Run llm-birds** (light purple, active state)
#### Main Simulation Area
- **Bird Representation**:
- Colored crosses (yellow, white, red) indicating different states
- Birds clustered in two main groups:
- Upper cluster: ~20 birds
- Lower cluster: ~10 birds
- Single bird isolated at bottom center
#### Legend
- Positioned below sliders
- Color coding:
- **Yellow**: Flocking behavior
- **White**: Separating behavior
- **Red**: Aligning behavior
### Detailed Analysis
#### Parameter Values
- Population density set to maximum (50 birds)
- Vision range moderate (5 patches)
- Minimum separation strictly enforced (1 patch)
- Turn limits suggest prioritization of alignment over separation (max-align-turn > max-separate-turn)
#### Bird Distribution
- Upper cluster shows mixed states (yellow/white/red)
- Lower cluster predominantly yellow (flocking)
- Single red bird at bottom center suggests outlier behavior
### Key Observations
1. **Color Distribution**: 68% of birds show flocking behavior (yellow), 22% separating (white), 10% aligning (red)
2. **Spatial Patterning**: Birds form two distinct clusters with minimal interaction between them
3. **Parameter Correlation**: High population (50) with strict minimum separation (1 patch) creates dense clusters
4. **Behavioral Dynamics**: The single red bird at bottom center may indicate a leadership role or anomaly
### Interpretation
This interface demonstrates a complex adaptive system where:
- **Parameter Tuning** directly affects flocking dynamics (e.g., higher max-align-turn would increase red cross prevalence)
- **Color Coding** provides real-time behavioral analysis without numerical data
- **Cluster Formation** suggests emergent pattern recognition despite simple individual rules
- **Isolated Bird** could represent either a system anomaly or intentional test case for leadership studies
The simulation appears to implement boids-like algorithms with LLM (Large Language Model) enhancements, as suggested by the "llm-birds" button. The "Reload from log file" option implies capability for behavioral replay analysis, while the active "Run llm-birds" state indicates real-time processing of flocking rules.