## Heatmap: Spatio-temporal Data Visualization
### Overview
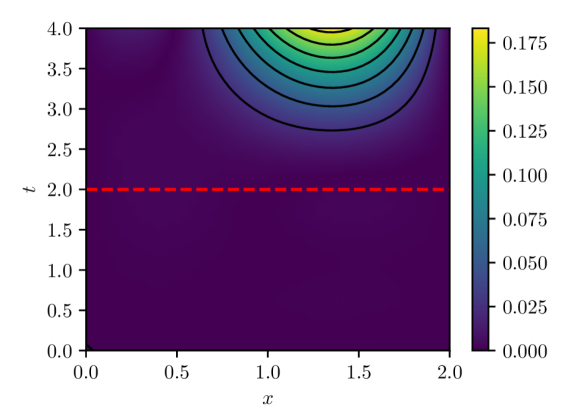
The image is a heatmap visualizing data across two dimensions, x and t. The color intensity represents the magnitude of the data, ranging from dark purple (low) to bright yellow (high). Black contour lines indicate regions of equal value. A red dashed line is present at t=2.0.
### Components/Axes
* **X-axis:** Labeled "x", ranges from 0.0 to 2.0 in increments of 0.5.
* **Y-axis:** Labeled "t", ranges from 0.0 to 4.0 in increments of 0.5.
* **Colorbar:** Located on the right side, ranging from 0.000 to 0.175. The color gradient goes from dark purple (0.000) to yellow (0.175), with intermediate values of 0.025, 0.050, 0.075, 0.100, 0.125, and 0.150.
* **Contour Lines:** Black lines indicating regions of equal value.
* **Red Dashed Line:** Horizontal line at t = 2.0.
### Detailed Analysis
* **Background Color:** The background color is dark purple, indicating low values across most of the x-t plane.
* **High-Value Region:** A region of high values (yellow) is located in the upper-center of the plot, approximately between x = 1.0 and x = 1.5, and t = 3.5 and t = 4.0.
* **Contour Lines:** The contour lines are concentrated around the high-value region, indicating a gradient of decreasing values as you move away from the center. The contours are roughly elliptical.
* **Red Dashed Line:** The red dashed line at t=2.0 appears to be a reference line.
### Key Observations
* The highest data values are concentrated in the upper-center region of the plot.
* The data values are generally low across the rest of the plot.
* The contour lines suggest a smooth, continuous distribution of values.
### Interpretation
The heatmap visualizes a spatio-temporal distribution where the highest values are localized in a specific region (around x=1.25, t=3.75). The red dashed line at t=2.0 might represent a threshold or a point of interest in the temporal dimension. The data suggests a phenomenon that is strongest in the upper-center region and diminishes as you move away from it in both the x and t dimensions. The nature of the phenomenon cannot be determined without additional context.