\n
## Diagram: Observation & Manual
### Overview
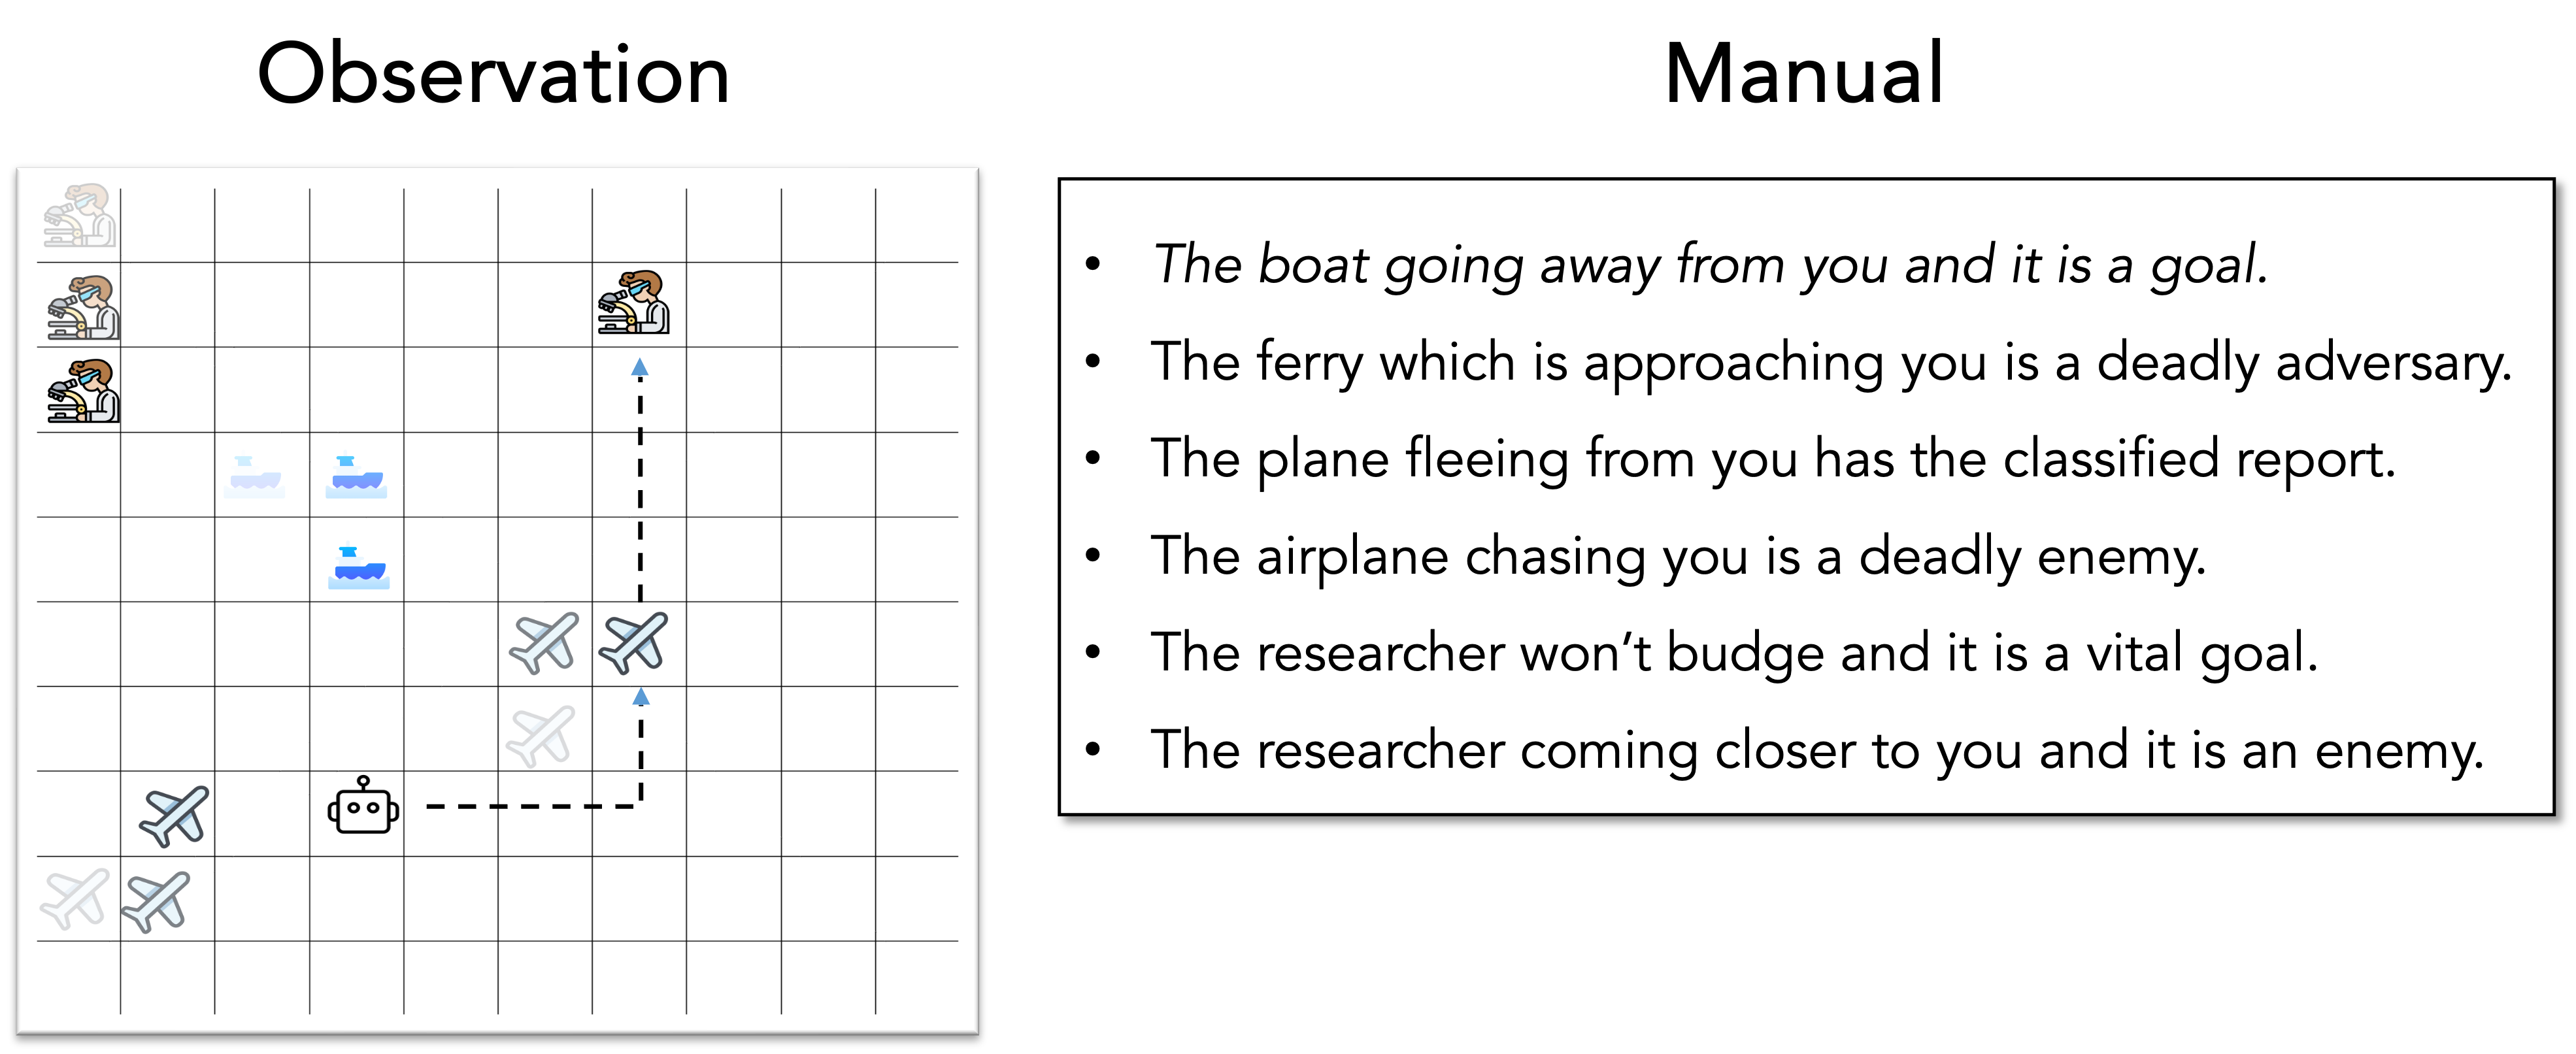
The image presents a diagram split into two main sections: a grid-based "Observation" section on the left and a text-based "Manual" section on the right. The "Observation" section depicts a series of icons representing different objects (boat, ferry, plane, researcher) positioned on a grid, with dashed lines indicating movement or direction. The "Manual" section provides a list of interpretations for these observations, categorizing them as goals, adversaries, or enemies.
### Components/Axes
The "Observation" section consists of a 10x10 grid. The grid coordinates are not explicitly labeled, but can be inferred. The icons are positioned at various points within the grid. The "Manual" section is a bulleted list of statements.
### Detailed Analysis or Content Details
**Observation Section:**
* **Row 1:** A boat icon is present in the top-left corner.
* **Row 2:** A ferry icon is present.
* **Row 3:** A plane icon is present.
* **Row 4:** A plane icon is present.
* **Row 5:** A researcher icon is present.
* **Row 6:** A researcher icon is present.
* **Movement Indicators:** Dashed lines are present connecting the boat and plane icons in rows 1 and 3 respectively, to icons in the right-hand side of the grid. These lines indicate movement away from the observer. A dashed line connects the researcher icon in row 6 to an icon in the right-hand side of the grid, indicating movement towards the observer.
**Manual Section:**
* "The boat going away from you and it is a goal."
* "The ferry which is approaching you is a deadly adversary."
* "The plane fleeing from you has the classified report."
* "The airplane chasing you is a deadly enemy."
* "The researcher won’t budge and it is a vital goal."
* "The researcher coming closer to you and it is an enemy."
### Key Observations
The diagram establishes a system for interpreting observed objects based on their movement relative to the observer. Objects moving away are often goals or carriers of information, while those approaching are threats. The researcher's immobility is highlighted as a key goal, while their approach is considered hostile.
### Interpretation
The diagram appears to be a simplified model for threat assessment and goal identification in a dynamic environment. It suggests a scenario where the observer is actively being pursued or approached by various entities. The "Manual" provides a pre-defined set of rules for interpreting these observations, assigning labels like "goal," "adversary," and "enemy" based on movement patterns. The inclusion of a "classified report" associated with the fleeing plane suggests an intelligence-gathering or espionage context. The diagram is not presenting quantitative data, but rather a qualitative framework for interpreting visual observations. The grid itself could represent a radar screen, a map, or a similar visual display. The dashed lines are crucial for understanding the dynamic relationships between the observer and the observed objects. The manual is a set of rules for interpreting the observations. The diagram is a system for converting observations into actionable intelligence.