## Diagram: Scenario Analysis Grid with Manual Instructions
### Overview
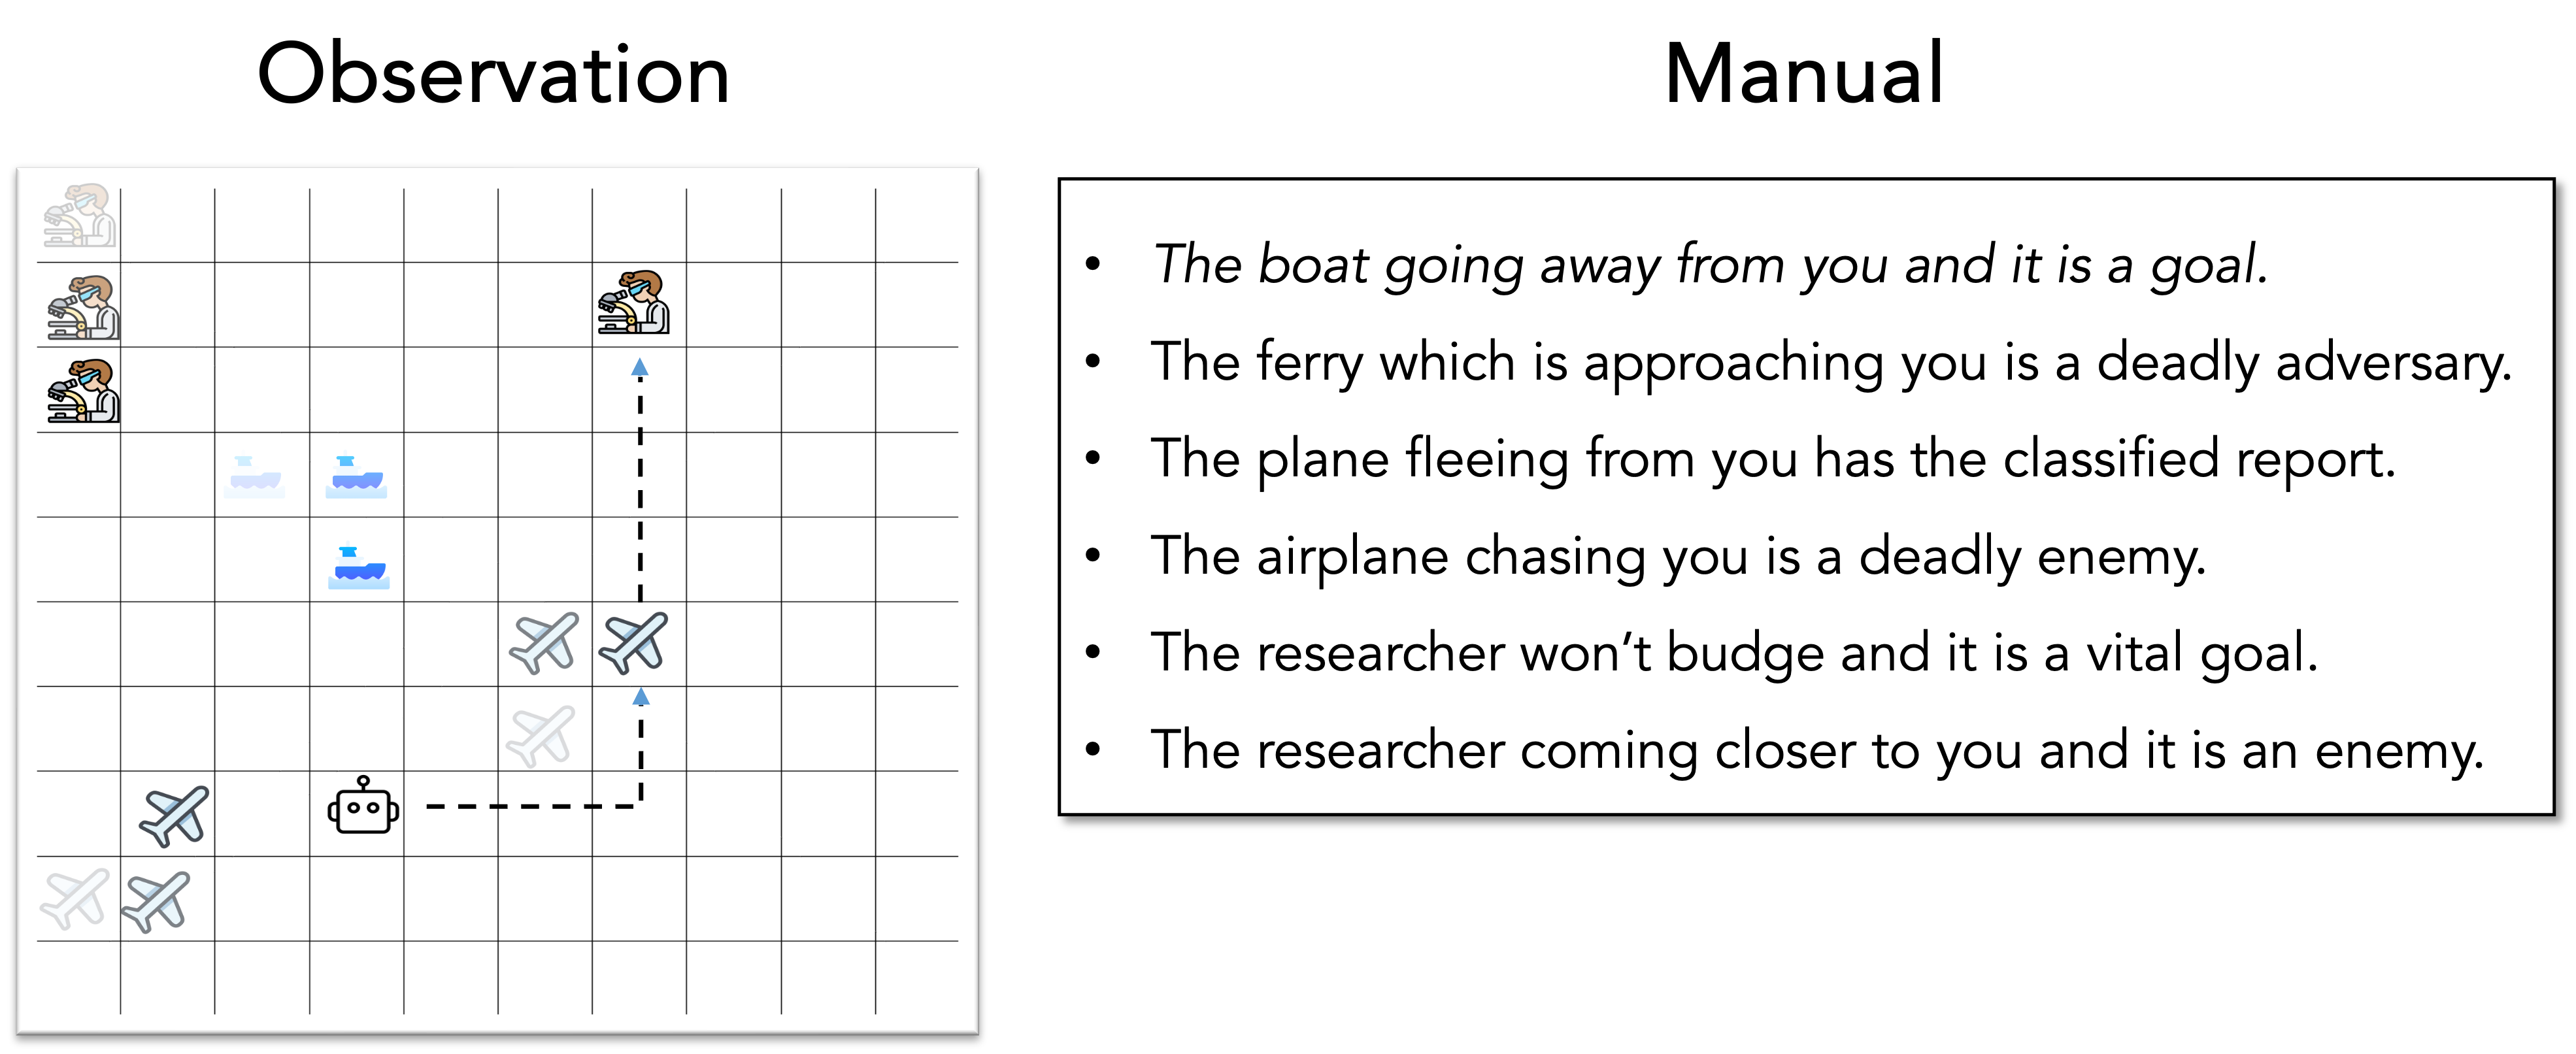
The image contains two primary sections: a grid labeled "Observation" and a list labeled "Manual." The grid uses icons (e.g., people with binoculars, boats, airplanes, robots) and dashed lines to represent relationships or movements. The "Manual" section lists six bullet points describing scenarios involving boats, ferries, planes, and researchers.
### Components/Axes
- **Grid (Observation Section)**:
- **Structure**: 8 rows × 8 columns (total 64 cells).
- **Icons**:
- **People with binoculars**: 3 instances (top-left, middle-left, top-right).
- **Boats**: 2 instances (middle-left, middle-right).
- **Airplanes**: 4 instances (bottom-left, bottom-middle, bottom-right, middle-right).
- **Robot**: 1 instance (middle-left).
- **Dashed Lines**:
- A vertical dashed line connects the top-right binocular icon to the middle-right airplane.
- A horizontal dashed line connects the middle-left robot to the bottom-middle airplane.
- **Labels**:
- "Observation" (top-left corner).
- **Manual Section**:
- **Text**: Six bullet points describing scenarios:
1. *The boat going away from you and it is a goal.*
2. *The ferry which is approaching you is a deadly adversary.*
3. *The plane fleeing from you has the classified report.*
4. *The airplane chasing you is a deadly enemy.*
5. *The researcher won’t budge and it is a vital goal.*
6. *The researcher coming closer to you and it is an enemy.*
### Detailed Analysis
- **Grid**:
- The grid appears to map spatial relationships or movements of entities (e.g., boats, airplanes, researchers).
- Dashed lines suggest directional or causal connections (e.g., a researcher’s movement influencing an airplane’s path).
- No numerical data or axis labels are present; the grid is purely symbolic.
- **Manual**:
- The bullet points define rules or objectives for interpreting the grid.
- Each bullet assigns a "goal," "adversary," or "enemy" status to specific entities based on their actions (e.g., "approaching," "fleeing," "chasing").
### Key Observations
- The grid and manual are interdependent: the grid visualizes entities, while the manual provides context for their roles.
- The robot icon is isolated in the grid but not referenced in the manual, suggesting it may be a neutral or undefined element.
- The dashed lines imply dynamic interactions (e.g., a researcher’s movement affecting an airplane’s trajectory).
### Interpretation
This diagram likely represents a decision-making or scenario analysis framework. The grid maps entities and their spatial relationships, while the manual defines their roles (e.g., "goal," "adversary"). For example:
- A boat moving away is a "goal," implying it is desirable.
- A ferry approaching is a "deadly adversary," suggesting it poses a threat.
- A plane fleeing with a "classified report" indicates it is a critical asset.
- Researchers are framed as either "vital goals" (if stationary) or "enemies" (if approaching).
The absence of numerical data or explicit labels for the grid’s axes suggests it is a conceptual or symbolic representation rather than a quantitative analysis. The manual’s rules may guide users in interpreting the grid’s symbolic elements in a specific context (e.g., strategy, risk assessment, or game mechanics).