## Line Chart: Model Performance
### Overview
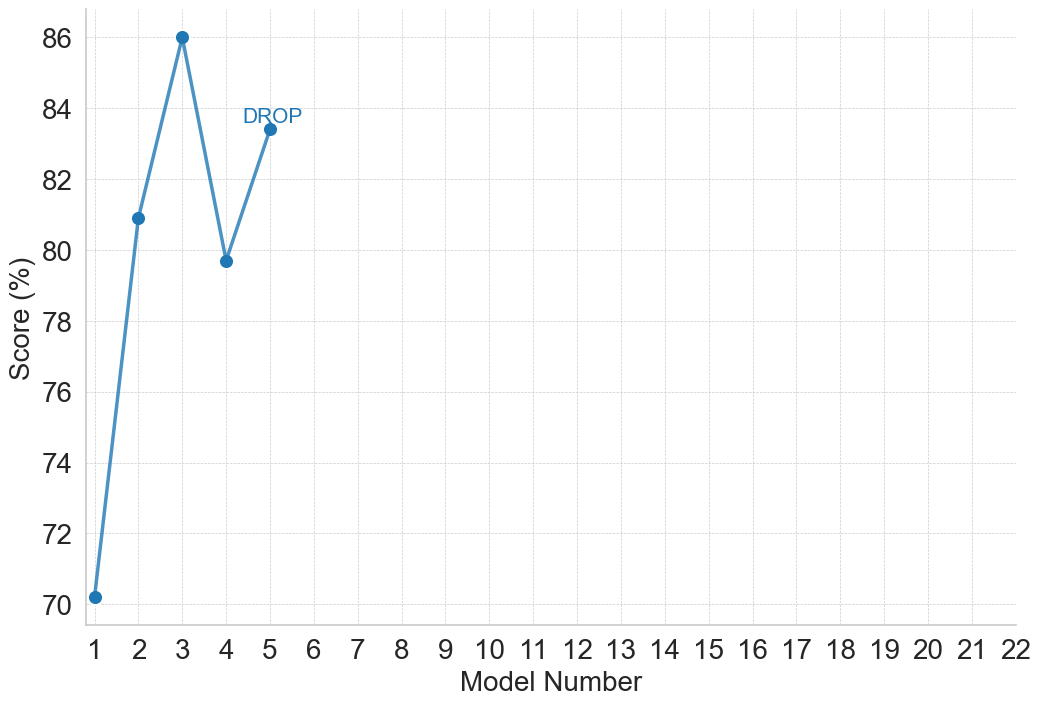
The image is a line chart showing the performance score (%) of different models, numbered 1 through 22. The chart displays a single data series, represented by a blue line with circular markers, indicating the score for each model. The performance initially increases sharply, peaks, then decreases before slightly increasing again.
### Components/Axes
* **X-axis:** "Model Number", labeled from 1 to 22 in increments of 1.
* **Y-axis:** "Score (%)", labeled from 70 to 86 in increments of 2.
* **Data Series:** A single blue line with circular markers representing the performance score of each model.
* **Annotation:** The word "DROP" is written near the data point for Model Number 5.
### Detailed Analysis
The blue line represents the performance score of the models.
* **Model 1:** Score is approximately 70%.
* **Model 2:** Score is approximately 81%.
* **Model 3:** Score is approximately 86%.
* **Model 4:** Score is approximately 80%.
* **Model 5:** Score is approximately 83%. The annotation "DROP" is near this point.
* **Models 6-22:** The line is not visible, implying the score is not available or not plotted.
### Key Observations
* The model performance peaks at Model 3 with a score of approximately 86%.
* There is a sharp increase in performance from Model 1 to Model 3.
* There is a decrease in performance from Model 3 to Model 4.
* The performance increases slightly from Model 4 to Model 5.
* The data for models 6 through 22 is not displayed on the chart.
### Interpretation
The chart illustrates the performance of different models, with Model 3 achieving the highest score. The annotation "DROP" near Model 5 might indicate a significant change or event related to that model. The absence of data for models 6-22 suggests that either the data is missing, or those models were not part of the analysis. The initial increase in performance followed by a decrease suggests a potential optimization process where Model 3 represents a peak, and subsequent models may have undergone changes that affected their performance. Further context is needed to understand the significance of the "DROP" annotation and the missing data.