## Line Chart: Model Score Progression
### Overview
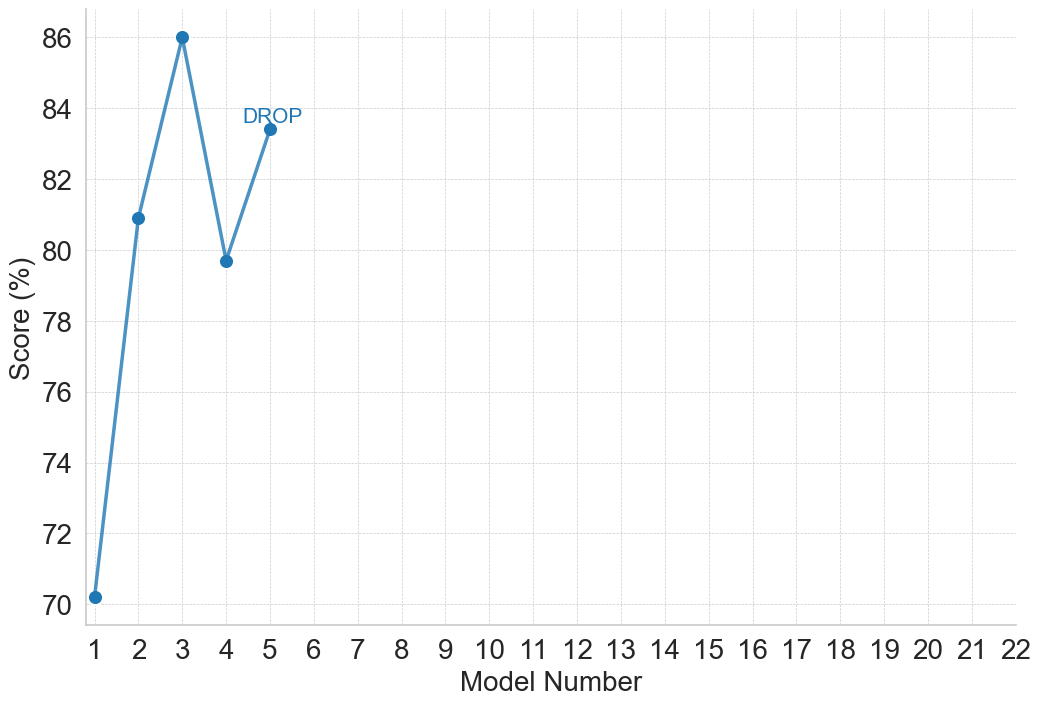
The image is a 2D line chart displaying the performance scores of a sequence of models. The chart plots a single data series consisting of five connected data points against a grid. Notably, while the x-axis accommodates 22 distinct models, data is only provided for the first five, with the final data point explicitly annotated with the word "DROP". The language used in the chart is entirely English.
### Components/Axes
**Component Isolation & Spatial Grounding:**
* **Y-Axis (Left):**
* **Label:** "Score (%)" (Rotated 90 degrees counter-clockwise, centered vertically).
* **Scale:** Continuous numerical scale starting at 70 at the bottom and ending at 86 at the top.
* **Markers:** Tick marks and corresponding labels are placed at intervals of 2 (70, 72, 74, 76, 78, 80, 82, 84, 86).
* **X-Axis (Bottom):**
* **Label:** "Model Number" (Centered horizontally below the axis numbers).
* **Scale:** Discrete integer scale.
* **Markers:** Numbered sequentially from 1 to 22, with a tick mark for every integer.
* **Grid Area (Center/Main):** Light gray, dashed grid lines extend from every tick mark on both the x and y axes, creating a coordinate matrix.
* **Data Series:** A single solid blue line connecting solid blue circular markers.
* **Annotation (Top-Left Quadrant):** The text "DROP" appears in blue, positioned directly above the data point at x=5.
### Detailed Analysis
**Trend Verification and Data Extraction:**
The data series consists of a single blue line tracking five points.
1. **Model 1:** The line begins at the bottom left.
* *Value:* Located just above the 70 line. Approximately **~70.2%**.
2. **Trend 1 to 2:** A steep upward slope.
* **Model 2:** The point is located roughly halfway between the 80 and 82 grid lines. Approximately **~80.9%**.
3. **Trend 2 to 3:** A continued upward slope, though slightly less steep than the previous segment.
* **Model 3:** The point rests exactly on the top grid line. Exactly **86.0%**.
4. **Trend 3 to 4:** A sharp, steep downward slope.
* **Model 4:** The point falls just below the 80 grid line. Approximately **~79.7%**.
5. **Trend 4 to 5:** A moderate upward slope.
* **Model 5:** The point is located between 82 and 84, closer to the 84 line. Approximately **~83.4%**.
* *Embedded Text:* This specific point is annotated with the word "**DROP**" in matching blue text.
6. **Models 6 through 22:** The chart area is completely empty. No data points or lines are drawn in this region.
### Key Observations
* **High Volatility:** The scores fluctuate significantly between models, with a massive initial jump (+~10.7%), a peak, a severe regression (-~6.3%), and a partial recovery.
* **Peak Performance:** Model 3 achieved the highest score (86.0%) of the recorded set.
* **Incomplete Data Set:** The x-axis is explicitly scaled to accommodate 22 models, but the data abruptly terminates at Model 5.
* **Visual-Textual Contradiction:** The annotation "DROP" occurs at a point where the visual trend is moving *upward* (from ~79.7% to ~83.4%).
### Interpretation
This chart likely represents an iterative machine learning training process, a hyperparameter tuning sequence, or sequential statistical modeling.
The data demonstrates a search for optimal performance. Model 1 serves as a low-performing baseline. Subsequent iterations (Models 2 and 3) show rapid improvement, peaking at 86%. The sharp decline at Model 4 suggests a change in parameters that negatively impacted the model's accuracy/score.
The most critical piece of information requires reading between the lines regarding the "DROP" annotation and the empty space from models 6 to 22. Because the score actually *increased* from Model 4 to Model 5, the word "DROP" does not describe a drop in the metric itself. Instead, applying Peircean abductive reasoning, "DROP" almost certainly indicates an action taken by the researcher: the experiment, training run, or specific model lineage was **dropped** (terminated or abandoned) at step 5.
The presence of an x-axis extending to 22 strongly implies that a 22-step process was originally planned or is the standard length for this type of evaluation. The early termination at step 5—despite a slight recovery from step 4—suggests the researcher concluded that this specific model iteration path was no longer viable, perhaps because it failed to recover to the peak established by Model 3, or due to other unstated factors like overfitting or resource constraints.