\n
## Line Chart: Model Score Performance
### Overview
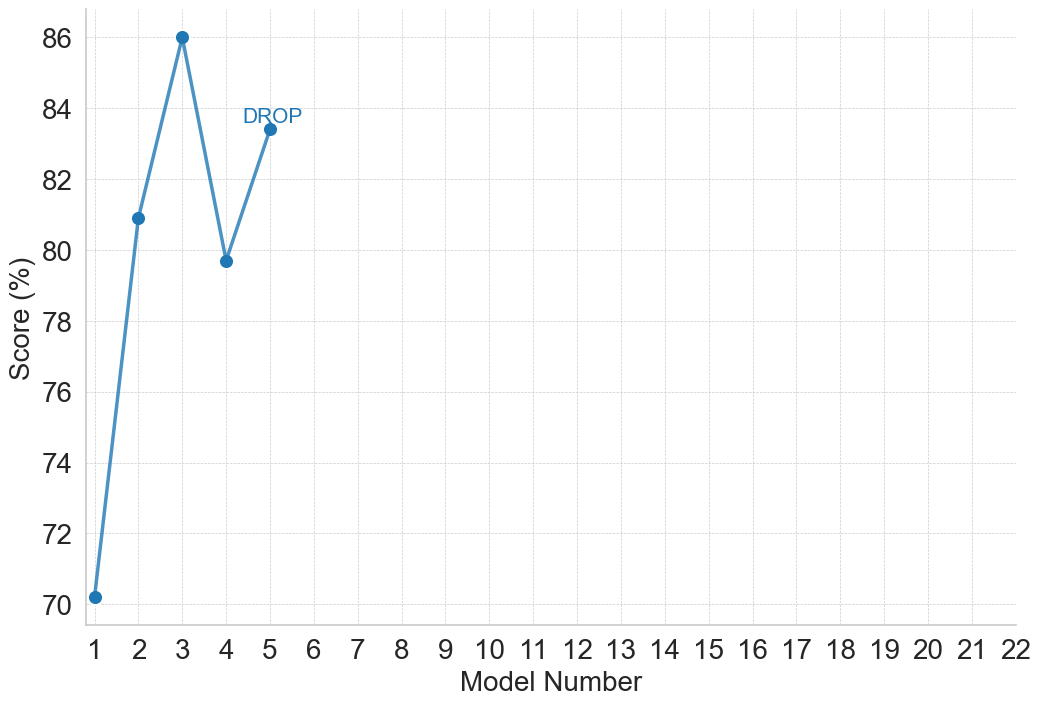
This image presents a line chart illustrating the performance score of a model across different model numbers. The chart displays a single data series showing the score (in percentage) as a function of the model number. A label "DROP" is placed near model number 6, indicating a significant decrease in score.
### Components/Axes
* **X-axis:** "Model Number" ranging from 1 to 22. The axis is marked with integer values.
* **Y-axis:** "Score (%)" ranging from 70 to 86. The axis is marked with integer values in increments of 2.
* **Data Series:** A single blue line representing the model score.
* **Label:** "DROP" positioned near the data point for Model Number 6.
### Detailed Analysis
The line chart shows an initial increase in score from Model Number 1 to Model Number 3, followed by a sharp decrease at Model Number 4, and a subsequent recovery to Model Number 3's score at Model Number 5. The score then drops significantly at Model Number 6, as indicated by the "DROP" label. After Model Number 6, the score remains relatively constant at approximately 80%.
Here's a breakdown of approximate score values based on visual estimation:
* Model 1: ~71%
* Model 2: ~82%
* Model 3: ~86%
* Model 4: ~80%
* Model 5: ~82%
* Model 6: ~79%
* Model 7-22: ~80%
The line slopes upward from Model 1 to Model 3, then downward to Model 4, upward to Model 5, and then sharply downward to Model 6. After Model 6, the line is relatively flat.
### Key Observations
* The highest score is achieved at Model Number 3 (~86%).
* The most significant drop in score occurs at Model Number 6, as highlighted by the "DROP" label.
* The score stabilizes around 80% after Model Number 6.
* There is a clear fluctuation in score between Model 1 and Model 6, after which the score becomes relatively stable.
### Interpretation
The chart suggests that the model's performance is sensitive to changes implemented around Model Number 6. The "DROP" label indicates a potential issue or negative impact introduced with that model version. The initial increase in score from Model 1 to Model 3 could represent a period of optimization or improvement. The subsequent fluctuations and eventual stabilization suggest that the model reached a point of diminishing returns or encountered a limiting factor. The consistent score after Model 6 might indicate that further modifications are not significantly improving performance, or that the model has converged to a stable state. Further investigation is needed to understand the cause of the drop at Model Number 6 and determine whether it can be mitigated. The data suggests that the model is not consistently improving with each iteration after Model 3, and that changes introduced around Model 6 had a detrimental effect.