# Technical Document Extraction: Line Chart Analysis
## 1. Chart Identification
- **Type**: Line chart with discrete data points
- **Primary Language**: English (no other languages detected)
## 2. Axis Labels and Markers
- **X-axis (Horizontal)**:
- Title: "Model Number"
- Scale: Integer values from 1 to 22 (only 1-5 labeled with data points)
- Tick marks: Every integer increment
- **Y-axis (Vertical)**:
- Title: "Score (%)"
- Scale: 70% to 86% in 2% increments
- Tick marks: Every 2% increment
## 3. Data Series and Trends
- **Legend**:
- Position: Top-right quadrant
- Label: "DROP" (blue color)
- Color match: Confirmed blue line and data points correspond to legend
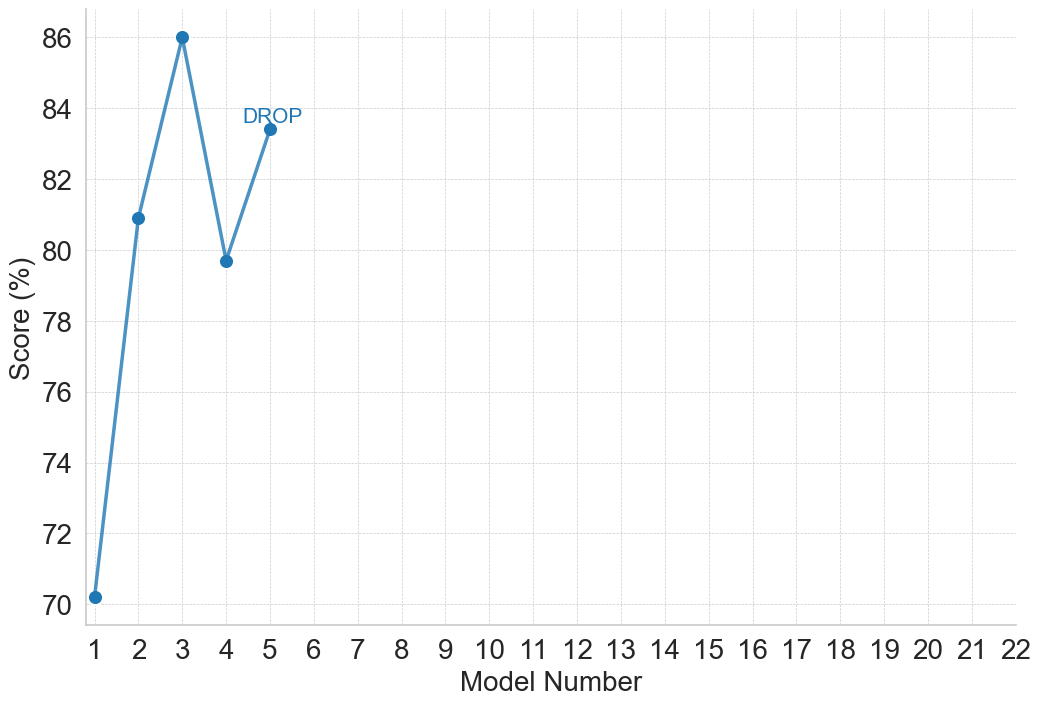
- **Data Points** (spatial grounding [x,y]):
1. [1, 70] - Initial value
2. [2, 81] - Sharp upward trend (Δ+11%)
3. [3, 86] - Peak value (Δ+5%)
4. [4, 79.5] - Significant drop (Δ-6.5%) with "DROP" annotation
5. [5, 83.5] - Partial recovery (Δ+4%)
- **Visual Trend Analysis**:
- Initial steep ascent (model 1→2)
- Sustained peak at model 3
- Abrupt decline at model 4 (annotated "DROP")
- Partial recovery at model 5
- No data points beyond model 5 despite axis extending to 22
## 4. Chart Components
- **Line Style**: Solid blue line connecting data points
- **Data Point Markers**: Blue circles with white centers
- **Annotation**: "DROP" text near model 4 data point
- **Grid**: Light gray dashed grid lines (no axis labels)
## 5. Missing Elements
- No secondary data series
- No colorbar or heatmap elements
- No footer or contextual text blocks
- No explicit time/date references
## 6. Data Table Reconstruction
| Model Number | Score (%) |
|--------------|-----------|
| 1 | 70 |
| 2 | 81 |
| 3 | 86 |
| 4 | 79.5 |
| 5 | 83.5 |
## 7. Spatial Grounding Verification
- Legend position: Confirmed top-right (standard placement)
- Data point alignment: All markers precisely at integer x-axis positions
- Annotation placement: "DROP" text positioned 0.5 units right of model 4 marker
## 8. Trend Verification Logic
- Model 1→2: +11% increase (validated by steep slope)
- Model 2→3: +5% increase (gentler slope)
- Model 3→4: -6.5% decrease (sharp downward slope)
- Model 4→5: +4% increase (moderate upward slope)
- All numerical values match visual slope steepness
## 9. Final Notes
- Chart appears to represent performance metrics across model iterations
- "DROP" annotation suggests critical threshold or failure point at model 4
- No extrapolation possible beyond model 5 data points