## Line Chart: BTC/SD vs. S&P500
### Overview
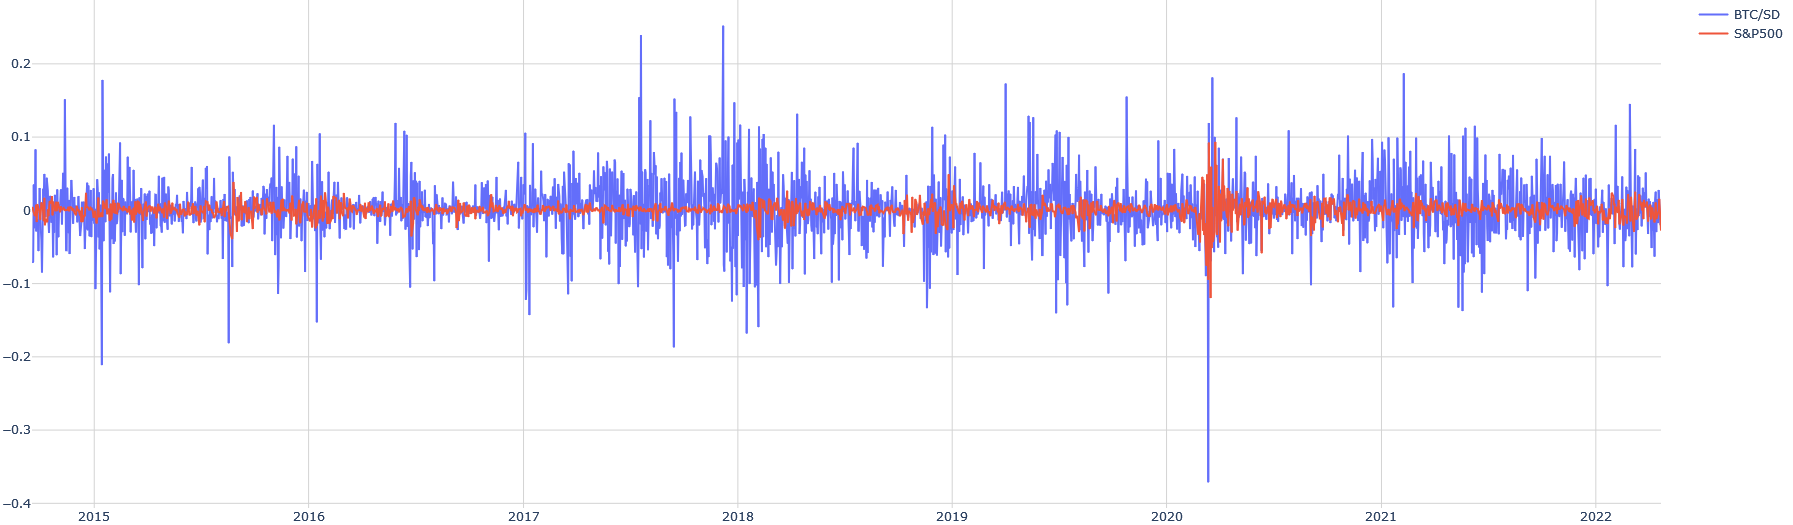
The image is a line chart comparing the fluctuations of BTC/SD (Bitcoin Standard Deviation) and S&P500 over time, from 2015 to 2022. The chart displays the volatility of BTC/SD relative to the S&P500, with BTC/SD showing significantly higher fluctuations.
### Components/Axes
* **X-axis:** Represents time, labeled with years from 2015 to 2022.
* **Y-axis:** Represents the value, ranging from -0.4 to 0.2, with increments of 0.1.
* **Legend (Top-Right):**
* Blue line: BTC/SD
* Red line: S&P500
### Detailed Analysis
* **BTC/SD (Blue Line):** The BTC/SD line shows high volatility with frequent and large swings both above and below the zero line.
* From 2015 to early 2018, the fluctuations are generally within the range of -0.1 to 0.1, with occasional spikes.
* In 2018, the volatility increases, with peaks reaching above 0.2 and troughs going below -0.2.
* A significant drop occurs around 2020, reaching approximately -0.4.
* After 2020, the volatility remains high, but the range of fluctuations seems to narrow slightly compared to 2018.
* **S&P500 (Red Line):** The S&P500 line shows relatively low volatility, staying close to the zero line throughout the entire period.
* The line fluctuates slightly around zero, with occasional deviations.
* Around 2020, there is a noticeable dip, but it is much less severe than the drop observed in the BTC/SD line.
### Key Observations
* **Volatility:** BTC/SD is significantly more volatile than the S&P500.
* **Correlation:** While both lines show some dips around 2020, the magnitude of the changes is vastly different, suggesting a weak correlation.
* **Range:** The S&P500 remains within a narrow range close to zero, while BTC/SD experiences much wider swings.
### Interpretation
The chart illustrates the higher risk and volatility associated with Bitcoin compared to the S&P500. The S&P500, representing a broader market index, exhibits more stability. The large fluctuations in BTC/SD suggest that it is more susceptible to market events and investor sentiment. The relatively stable S&P500 indicates a more diversified and less volatile investment. The data suggests that while both assets experienced a dip around 2020, the impact on Bitcoin was far more pronounced, highlighting its higher risk profile.