\n
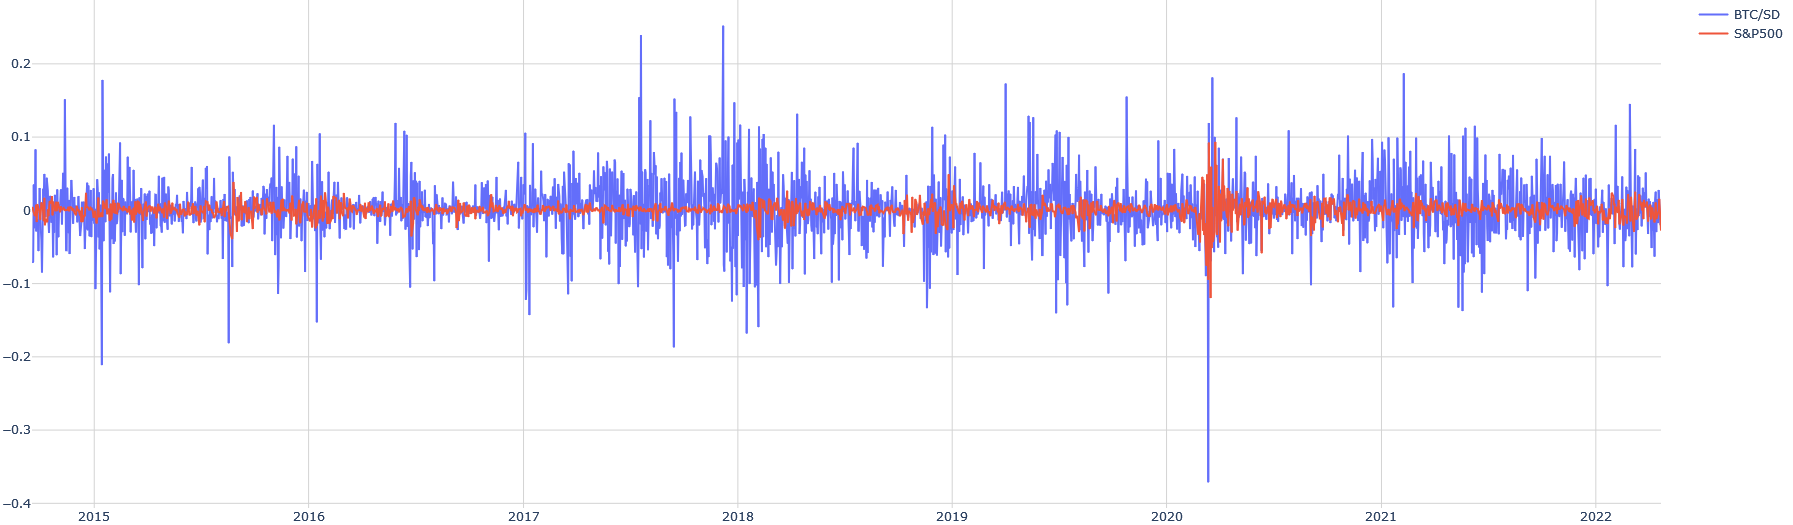
## Line Chart: BTC/USD and S&P500 Daily Returns
### Overview
This image presents a line chart comparing the daily returns of Bitcoin (BTC/USD) and the S&P 500 index over a period from approximately 2015 to 2022. The chart displays fluctuations in returns, with the y-axis representing the return value and the x-axis representing time.
### Components/Axes
* **X-axis:** Time, ranging from approximately 2015 to 2022. The axis is labeled with year markers.
* **Y-axis:** Daily Return, ranging from -0.4 to 0.2. The axis is linearly scaled.
* **Legend:** Located in the top-right corner.
* **Blue Line:** BTC/USD
* **Red Line:** S&P 500
* **Gridlines:** Horizontal gridlines are present to aid in reading the return values.
### Detailed Analysis
The chart shows two time series: BTC/USD daily returns (blue line) and S&P 500 daily returns (red line).
**BTC/USD (Blue Line):**
The BTC/USD line exhibits significantly higher volatility than the S&P 500 line. The line fluctuates wildly, with frequent and large positive and negative swings.
* **2015-2016:** The line fluctuates around 0, with some negative excursions.
* **2017:** A period of increasing volatility and generally positive returns.
* **2018:** A significant downturn, with returns dropping to approximately -0.3.
* **2019-2020:** Moderate volatility, fluctuating around 0.
* **2020:** A large negative spike, dropping to approximately -0.35, followed by a recovery.
* **2021:** High volatility with both positive and negative excursions.
* **2022:** Generally negative returns, with fluctuations around -0.1.
**S&P 500 (Red Line):**
The S&P 500 line is much smoother and less volatile than the BTC/USD line. It generally fluctuates within a narrower range.
* **2015-2017:** Relatively stable, fluctuating around 0.
* **2018:** A moderate downturn, with returns dropping to approximately -0.1.
* **2019-2020:** Generally positive returns, with fluctuations around 0.05.
* **2020:** A sharp negative spike, dropping to approximately -0.2, followed by a rapid recovery.
* **2021:** Moderate positive returns, fluctuating around 0.02.
* **2022:** Generally negative returns, fluctuating around -0.05.
It is difficult to extract precise numerical values from the chart due to its resolution. However, approximate values can be estimated.
### Key Observations
* **Volatility:** BTC/USD is significantly more volatile than the S&P 500.
* **Correlation:** There appears to be limited correlation between the two assets. While both experienced a downturn in 2018 and 2020, the magnitude and timing of the fluctuations differ.
* **Outliers:** The large negative spike in BTC/USD in 2020 is a notable outlier.
* **Trend:** Both assets show a general trend of fluctuating around 0, indicating that daily returns are often small.
### Interpretation
The chart demonstrates the substantial difference in volatility between Bitcoin and the S&P 500. Bitcoin exhibits much larger price swings, suggesting it is a riskier asset. The limited correlation between the two assets suggests that Bitcoin does not consistently move in the same direction as the broader stock market. The 2020 events show that both assets can experience significant downturns simultaneously, but the recovery patterns differ. The chart highlights the potential for both gains and losses in Bitcoin, while the S&P 500 offers a more stable, albeit potentially lower, return. The data suggests that Bitcoin may not be an effective hedge against broader market downturns, as both assets experienced declines in 2020.