## Line Chart: BTC/SD vs S&P500 Performance (2015–2022)
### Overview
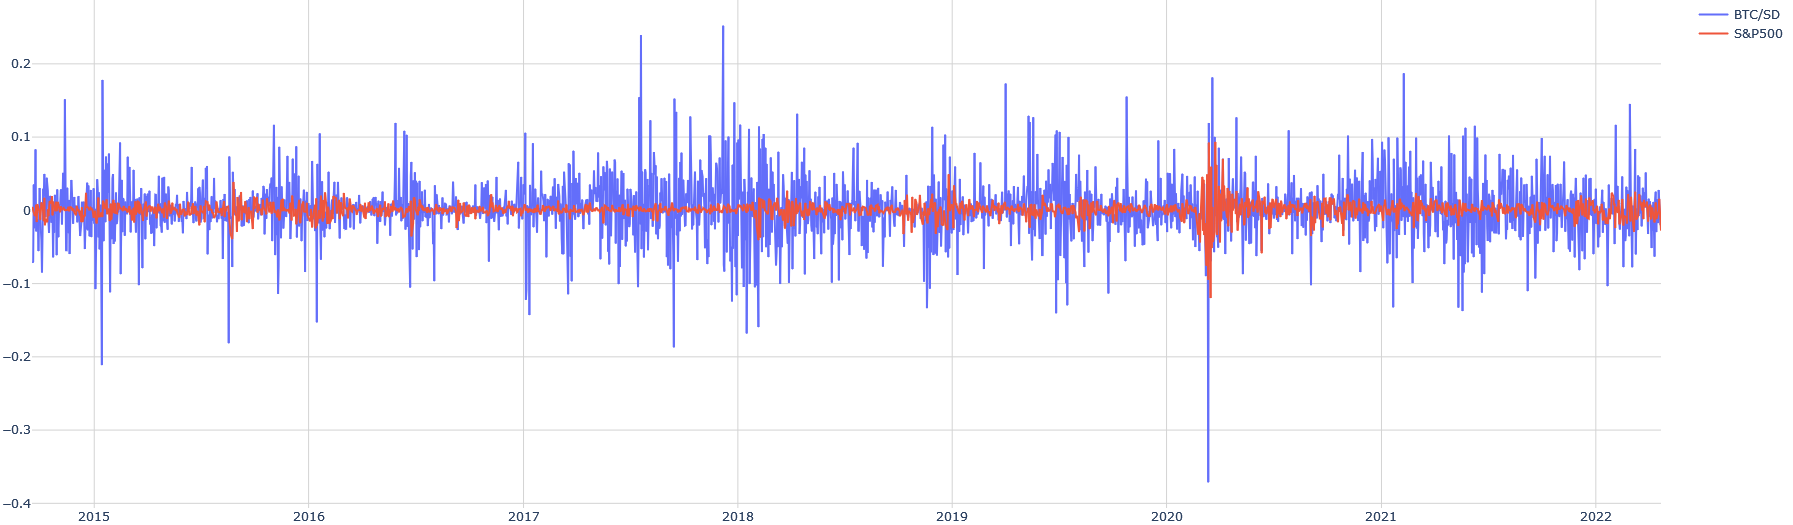
The chart compares the performance of two financial instruments—BTC/SD (blue line) and S&P500 (red line)—over an 8-year period (2015–2022). The y-axis represents normalized values ranging from -0.4 to 0.2, while the x-axis spans years. Both lines exhibit volatility, but with distinct patterns. The legend is positioned in the top-right corner, with blue denoting BTC/SD and red denoting S&P500.
### Components/Axes
- **X-axis (Years)**: Labeled with annual increments from 2015 to 2022. No explicit title, but contextually represents time.
- **Y-axis (Normalized Value)**: Ranges from -0.4 to 0.2 in 0.1 increments. No explicit title, but implied to measure performance deviation.
- **Legend**: Top-right corner. Blue = BTC/SD, Red = S&P500.
- **Gridlines**: Faint horizontal and vertical lines for reference.
### Detailed Analysis
- **BTC/SD (Blue Line)**:
- **Trend**: Highly volatile, with sharp peaks and troughs. Notable spikes in 2017 (~0.15), 2020 (~-0.4), and 2021 (~0.18). Persistent oscillations around zero.
- **Key Data Points**:
- 2015: ~0.05
- 2016: ~0.02
- 2017: ~0.15 (peak)
- 2018: ~-0.1
- 2019: ~0.03
- 2020: ~-0.4 (trough)
- 2021: ~0.18 (peak)
- 2022: ~0.01
- **Uncertainty**: Approximate values derived from visual estimation; exact values may vary by ±0.02 due to chart resolution.
- **S&P500 (Red Line)**:
- **Trend**: Relatively stable, fluctuating narrowly around zero. Minor peaks in 2017 (~0.02) and 2021 (~0.01). No extreme deviations.
- **Key Data Points**:
- 2015: ~0.0
- 2016: ~0.0
- 2017: ~0.02
- 2018: ~0.0
- 2019: ~0.0
- 2020: ~0.0
- 2021: ~0.01
- 2022: ~0.0
- **Uncertainty**: Values stable within ±0.01 due to minimal variation.
### Key Observations
1. **Volatility Disparity**: BTC/SD exhibits ~10x greater volatility than S&P500, with extreme swings (e.g., -0.4 in 2020 vs. 0.18 in 2021).
2. **Correlation**: Both lines show synchronized movements in 2017 and 2021, suggesting potential market-wide influences (e.g., crypto booms/busts).
3. **Anomalies**:
- BTC/SD’s 2020 trough (-0.4) aligns with the global pandemic crash.
- S&P500 remains flat during the same period, indicating resilience.
### Interpretation
- **BTC/SD Dynamics**: The extreme volatility reflects cryptocurrency market instability, likely driven by speculative trading, regulatory shifts, and macroeconomic factors. The 2020 crash and 2021 rebound highlight sensitivity to external shocks.
- **S&P500 Stability**: The red line’s consistency underscores the index’s role as a benchmark for traditional equity markets, less affected by crypto-specific risks.
- **Implications**: The divergence in 2020–2021 suggests crypto markets operate independently of traditional indices during crises, while overlapping peaks (2017, 2021) indicate shared exposure to speculative trends.
*Note: All values are approximate, derived from visual inspection of the chart. No textual annotations or embedded data tables are present.*