## Bar Chart: Weight (%) by Data Source for Different QA Blends
### Overview
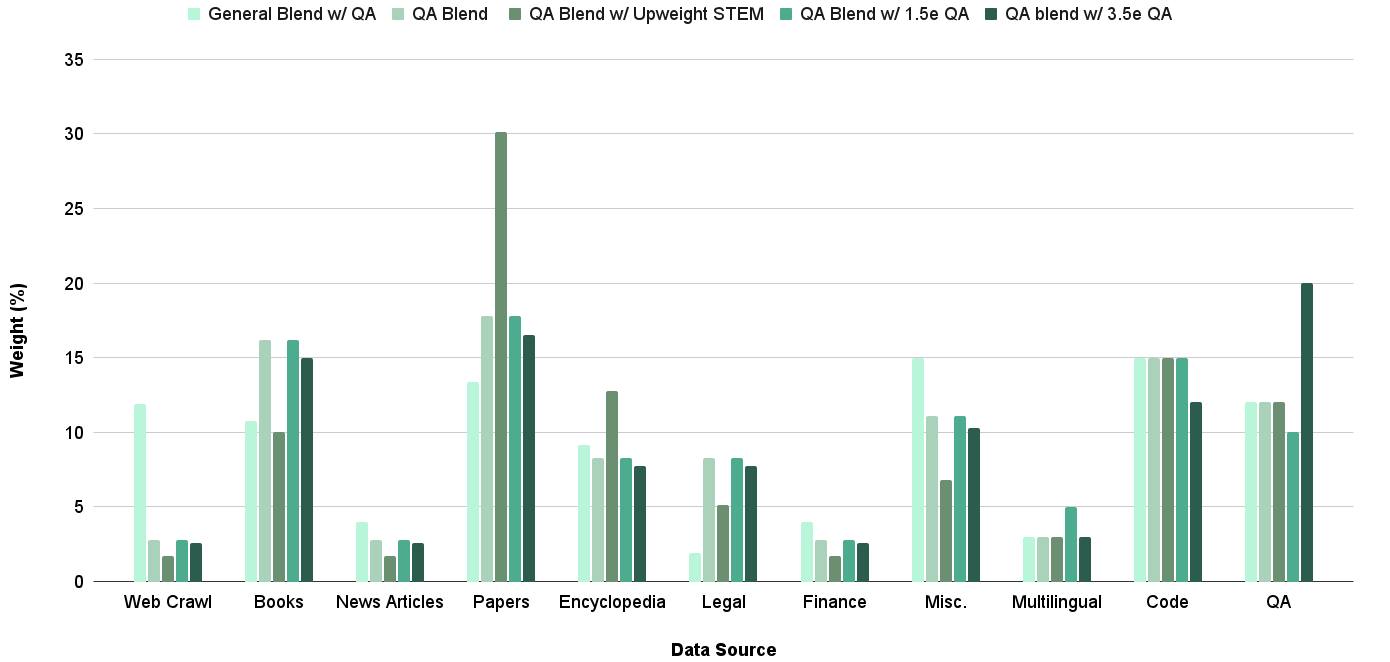
The image is a bar chart comparing the weight percentages of different data sources across various QA blends. The chart displays the distribution of data sources like Web Crawl, Books, News Articles, Papers, Encyclopedia, Legal, Finance, Misc., Multilingual, Code, and QA for each blend. The blends are "General Blend w/ QA", "QA Blend", "QA Blend w/ Upweight STEM", "QA Blend w/ 1.5e QA", and "QA blend w/ 3.5e QA".
### Components/Axes
* **X-axis:** Data Source (Web Crawl, Books, News Articles, Papers, Encyclopedia, Legal, Finance, Misc., Multilingual, Code, QA)
* **Y-axis:** Weight (%) - Scale from 0 to 35, incrementing by 5.
* **Legend:** Located at the top of the chart.
* General Blend w/ QA (light green)
* QA Blend (medium green)
* QA Blend w/ Upweight STEM (green)
* QA Blend w/ 1.5e QA (dark green)
* QA blend w/ 3.5e QA (darkest green)
### Detailed Analysis
Here's a breakdown of the weight percentages for each data source and QA blend:
* **Web Crawl:**
* General Blend w/ QA: ~12%
* QA Blend: ~2%
* QA Blend w/ Upweight STEM: ~3%
* QA Blend w/ 1.5e QA: ~2%
* QA blend w/ 3.5e QA: ~3%
* **Books:**
* General Blend w/ QA: ~11%
* QA Blend: ~16%
* QA Blend w/ Upweight STEM: ~16%
* QA Blend w/ 1.5e QA: ~10%
* QA blend w/ 3.5e QA: ~10%
* **News Articles:**
* General Blend w/ QA: ~3%
* QA Blend: ~2%
* QA Blend w/ Upweight STEM: ~3%
* QA Blend w/ 1.5e QA: ~2%
* QA blend w/ 3.5e QA: ~3%
* **Papers:**
* General Blend w/ QA: ~14%
* QA Blend: ~18%
* QA Blend w/ Upweight STEM: ~30%
* QA Blend w/ 1.5e QA: ~18%
* QA blend w/ 3.5e QA: ~16%
* **Encyclopedia:**
* General Blend w/ QA: ~8%
* QA Blend: ~13%
* QA Blend w/ Upweight STEM: ~8%
* QA Blend w/ 1.5e QA: ~8%
* QA blend w/ 3.5e QA: ~6%
* **Legal:**
* General Blend w/ QA: ~8%
* QA Blend: ~8%
* QA Blend w/ Upweight STEM: ~8%
* QA Blend w/ 1.5e QA: ~6%
* QA blend w/ 3.5e QA: ~4%
* **Finance:**
* General Blend w/ QA: ~3%
* QA Blend: ~2%
* QA Blend w/ Upweight STEM: ~2%
* QA Blend w/ 1.5e QA: ~3%
* QA blend w/ 3.5e QA: ~2%
* **Misc.:**
* General Blend w/ QA: ~15%
* QA Blend: ~7%
* QA Blend w/ Upweight STEM: ~11%
* QA Blend w/ 1.5e QA: ~10%
* QA blend w/ 3.5e QA: ~5%
* **Multilingual:**
* General Blend w/ QA: ~3%
* QA Blend: ~3%
* QA Blend w/ Upweight STEM: ~3%
* QA Blend w/ 1.5e QA: ~3%
* QA blend w/ 3.5e QA: ~3%
* **Code:**
* General Blend w/ QA: ~15%
* QA Blend: ~15%
* QA Blend w/ Upweight STEM: ~12%
* QA Blend w/ 1.5e QA: ~12%
* QA blend w/ 3.5e QA: ~15%
* **QA:**
* General Blend w/ QA: ~12%
* QA Blend: ~12%
* QA Blend w/ Upweight STEM: ~10%
* QA Blend w/ 1.5e QA: ~12%
* QA blend w/ 3.5e QA: ~20%
### Key Observations
* The "Papers" data source has a significantly higher weight percentage for the "QA Blend w/ Upweight STEM" compared to other blends.
* The "QA blend w/ 3.5e QA" has the highest weight percentage for the "QA" data source.
* "Web Crawl", "News Articles", "Finance", and "Multilingual" have relatively low weight percentages across all blends.
* "Code" has a consistent weight percentage across all blends, around 12-15%.
### Interpretation
The chart illustrates how different QA blends utilize various data sources. The "QA Blend w/ Upweight STEM" heavily relies on "Papers," suggesting a focus on scientific or academic content. The "QA blend w/ 3.5e QA" places a strong emphasis on "QA" data, indicating a blend optimized for quality assurance tasks. The consistent weight of "Code" across blends suggests its importance in all QA processes. The low weight of "Web Crawl," "News Articles," "Finance," and "Multilingual" might indicate these sources are less relevant or reliable for the specific QA tasks these blends are designed for.