\n
## Bar Chart: Data Source Weight Distribution
### Overview
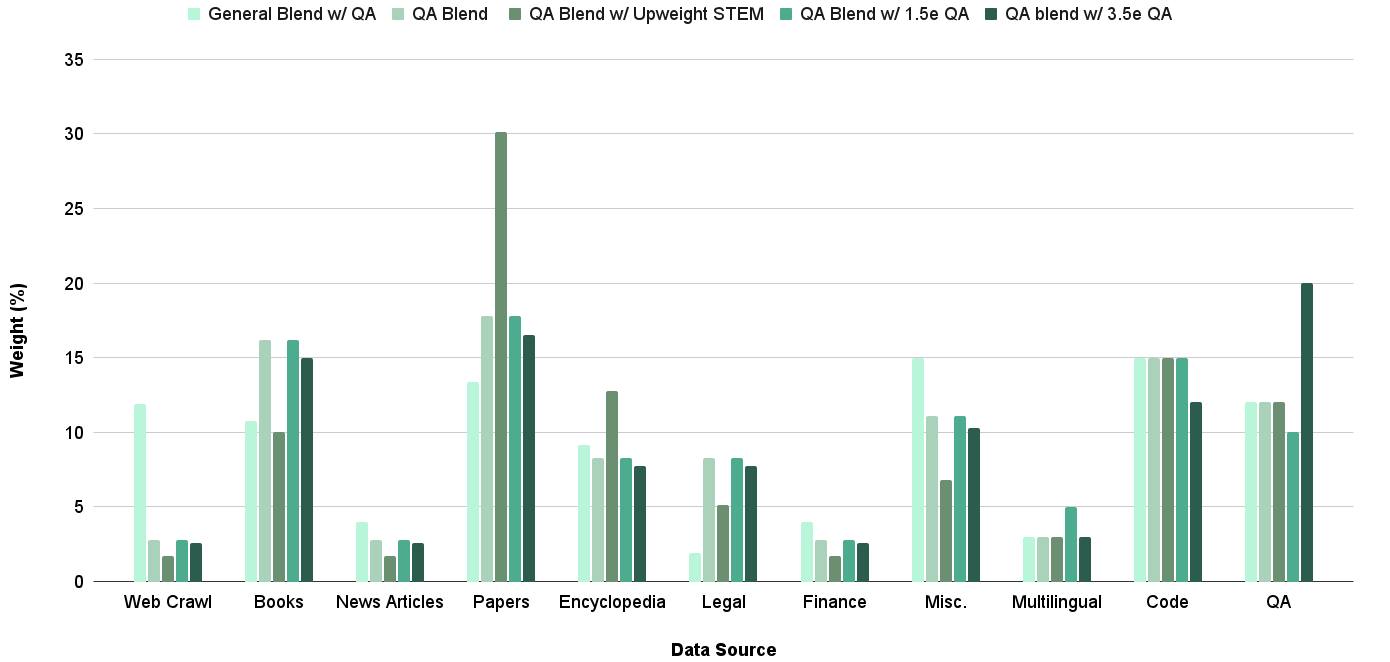
This is a bar chart illustrating the weight (percentage) of different data sources used in a blend, across several blend configurations. The x-axis represents the data source, and the y-axis represents the weight in percentage. There are six different blend configurations represented by different shades of green.
### Components/Axes
* **X-axis Title:** Data Source
* **Y-axis Title:** Weight (%)
* **X-axis Categories:** Web Crawl, Books, News Articles, Papers, Encyclopedia, Legal, Finance, Misc., Multilingual, Code, QA
* **Legend (Top-Right):**
* General Blend w/ QA (Light Green)
* QA Blend (Medium Light Green)
* QA Blend w/ Upweight STEM (Medium Green)
* QA Blend w/ 1.5e QA (Dark Green)
* QA Blend w/ 3.5e QA (Very Dark Green)
### Detailed Analysis
The chart displays the weight percentage for each data source across the six blend configurations.
* **Web Crawl:**
* General Blend w/ QA: ~1.5%
* QA Blend: ~1%
* QA Blend w/ Upweight STEM: ~1.5%
* QA Blend w/ 1.5e QA: ~2%
* QA Blend w/ 3.5e QA: ~2%
* **Books:**
* General Blend w/ QA: ~3%
* QA Blend: ~2.5%
* QA Blend w/ Upweight STEM: ~3%
* QA Blend w/ 1.5e QA: ~3.5%
* QA Blend w/ 3.5e QA: ~3.5%
* **News Articles:**
* General Blend w/ QA: ~3.5%
* QA Blend: ~3%
* QA Blend w/ Upweight STEM: ~3.5%
* QA Blend w/ 1.5e QA: ~4%
* QA Blend w/ 3.5e QA: ~4%
* **Papers:**
* General Blend w/ QA: ~30%
* QA Blend: ~28%
* QA Blend w/ Upweight STEM: ~29%
* QA Blend w/ 1.5e QA: ~30%
* QA Blend w/ 3.5e QA: ~30%
* **Encyclopedia:**
* General Blend w/ QA: ~15%
* QA Blend: ~13%
* QA Blend w/ Upweight STEM: ~14%
* QA Blend w/ 1.5e QA: ~15%
* QA Blend w/ 3.5e QA: ~15%
* **Legal:**
* General Blend w/ QA: ~7%
* QA Blend: ~6%
* QA Blend w/ Upweight STEM: ~7%
* QA Blend w/ 1.5e QA: ~7.5%
* QA Blend w/ 3.5e QA: ~7.5%
* **Finance:**
* General Blend w/ QA: ~2%
* QA Blend: ~1.5%
* QA Blend w/ Upweight STEM: ~2%
* QA Blend w/ 1.5e QA: ~2.5%
* QA Blend w/ 3.5e QA: ~2.5%
* **Misc.:**
* General Blend w/ QA: ~10%
* QA Blend: ~8%
* QA Blend w/ Upweight STEM: ~9%
* QA Blend w/ 1.5e QA: ~10%
* QA Blend w/ 3.5e QA: ~10%
* **Multilingual:**
* General Blend w/ QA: ~3%
* QA Blend: ~2%
* QA Blend w/ Upweight STEM: ~2.5%
* QA Blend w/ 1.5e QA: ~3%
* QA Blend w/ 3.5e QA: ~3%
* **Code:**
* General Blend w/ QA: ~13%
* QA Blend: ~15%
* QA Blend w/ Upweight STEM: ~14%
* QA Blend w/ 1.5e QA: ~14%
* QA Blend w/ 3.5e QA: ~14%
* **QA:**
* General Blend w/ QA: ~11%
* QA Blend: ~11%
* QA Blend w/ Upweight STEM: ~10%
* QA Blend w/ 1.5e QA: ~11%
* QA Blend w/ 3.5e QA: ~11%
### Key Observations
* "Papers" consistently has the highest weight across all blend configurations, ranging around 30%.
* "Web Crawl", "Finance", and "Multilingual" consistently have the lowest weights across all configurations, generally below 5%.
* The "QA Blend" configuration generally shows lower weights for "Papers" and "Encyclopedia" compared to the "General Blend w/ QA".
* The weights for most data sources remain relatively stable across the different QA blend configurations (1.5e QA and 3.5e QA).
### Interpretation
The chart demonstrates the composition of different data blends, highlighting the relative importance of various data sources. The dominance of "Papers" suggests that this source is crucial for the overall blend's performance. The variations in weights across the different QA blends indicate that adjusting the QA parameters can influence the contribution of other data sources. The relatively stable weights in the 1.5e and 3.5e QA blends suggest a saturation point where further QA adjustments do not significantly alter the blend's composition. The consistent low weights for "Web Crawl", "Finance", and "Multilingual" might indicate that these sources are less relevant or contribute less value to the blend's overall quality. The chart provides valuable insights into the data mix and the impact of QA adjustments, which can be used to optimize the blend for specific applications.